Explanation:
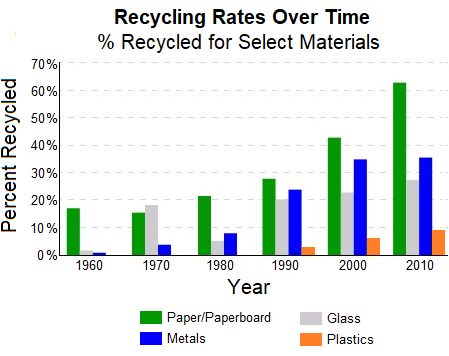
The "Percent Recycled" for metal is displayed in blue bars. In 1990, this bar first rises above 20%.
Explanation:
The bars display the number of US hurricanes each decade. The 1980s bar displays 18 hurricanes.
Explanation:
The percentage of drink sales for the vending channel is 11%, as indicated by the grey slice in the pie chart.
Explanation:
Two grid squares to the right of 2005 are the years 2007 and 2008. It is barely below 175 when we follow this up to the line of optimum fit. The only sensible option is 170.
Explanation:
The hole diameter is given in millimeters in the third column. Finding the row with "9.09 MM" reveals that the required hole size will be produced using a "T" letter gauge bit.
Explanation:
For glass, the "Percent Recycled" bars are gray, and for paper, they are green. In just one year on the chart, 1970, the grey bar is taller than the green bar.
Explanation:
The two courses with the highest percentages are American Literature (11%) and Creative Writing (12%).
Advertisement
Explanation:
Find the 8% point on the y-axis to get started. Around 1976, the US graph (red) first breaches this line. The best response for when both exceed the 8% mark is 1982 because Canada (blue) first crosses this line around that year.
Explanation:
Find the row in the first column that has "Colony 3" in it. Cross across to the "2021" column from this row. The colony contains 512 bats, according to the display.
Explanation:
The number of robins is indicated by the orange line. The orange line grows, starting below the blue line of the snow owl in January and crossing it in the middle of February. Throughout the summer, it keeps rising before leveling out. Later, starting in September, the orange line quickly starts to descend before falling back below the blue line in November.
Explanation:
The courses in the history department are represented by pieces of orange pie. The orange slices represent 23% of the total number of registered pupils. With a total of 22%, the purple (Science) slices come in second place.
Explanation:
By using the "Cincinnati" row and moving across to the "Albany" column, you may find the 720-mile distance between Cincinnati and Albany. Similar distances exist between Albany and Destin (1340 miles), as well as between Cincinnati and Destin (730 miles). He'll cover 2790 miles in total.
Explanation:
The trend line displays around 120 for the year 2000, 155 for the year 2005, and 190 for the year 2010. In other words, the proportion of 3-Car Households tends to rise by 35 for every 5 years that pass. With this knowledge, 225 (3-car households) would be a reasonable projection for the year 2015 (i.e., 190 + 35).
Explanation:
The 5/8 inch diameter should be found in the first column. Three rows have different drilling depths. The worker needs a depth of 12 inches, therefore he or she must use either the 1512-inch-deep or the 3012-inch-deep bit. The shorter of the two drilling depths, at 1512 inches, will do the trick.
Advertisement
Explanation:
We respond "Yes" to the decision block asking "Check the power key is under control?" because the "power board output is 24 volts." We take her word for it that "the power key is under control," so we do what she says. She needs to "Replace the keyboard."
Explanation:
30% of $241,080 goes to housing: (0.30)($241,080) = $72,324