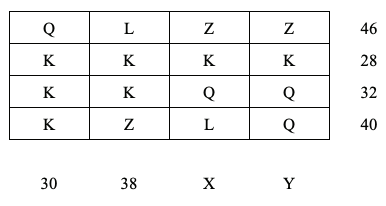
Explanation:
The value of Q is 9.
Explanation:
The schedules that meet the requirements of the Firefighters’ Union is column II.
Explanation:
Given that each set in the schedule should contain only one firefighter (as k = 1), and the requirement that each object occurs the same number of times in the schedule (r = 2), the firefighter that has not yet appeared in the schedule is 3. Therefore, adding Firefighter 3 to the next position completes the schedule correctly.
Explanation:
For the schedule to meet the conditions where each set contains two firefighters (k = 2) and each firefighter appears twice in the schedule (r = 2), the values of x and y must be chosen such that all firefighters are included twice. Since firefighters 1, 2, and 3 are involved, setting x = 1 and y = 3 ensures that all three firefighters are included twice, meeting the requirements.
Explanation:
This can be found by adding the number of students proficient in mathematics (16) and the number of students proficient in science (18), then subtracting the total number of students (25) to find the overlap.
Explanation:
Average speed is calculated by dividing the total distance traveled by the total time taken.
Explanation:
The square root of 144 is 12, as 12 × 12 = 144.
Advertisement
Explanation:
The control group provides a standard against which the experimental group, which receives the treatment or intervention, is compared. This helps researchers determine whether the results observed in the experimental group are due to the intervention or other factors.
Explanation:
Qualitative data is descriptive and categorical rather than numerical. Color descriptions represent qualitative data, whereas options A, B, and D represent quantitative data.
Explanation:
Statistical analysis in social sciences research is used to identify patterns, relationships, and trends in data. It helps researchers draw conclusions and make inferences about the population being studied.
Explanation:
Correlation is a statistical measure that quantifies the strength and direction of the relationship between two variables. It ranges from -1 to +1, where +1 indicates a perfect positive correlation, -1 indicates a perfect negative correlation, and 0 indicates no correlation.