How to Read an EEG Test: A Complete Guide to Brain Wave Patterns and Results
Learn how to read an EEG test, understand brain wave patterns, normal vs abnormal results, cost, and what technologists look for during interpretation. 🏆
An EEG test — short for electroencephalogram — is one of the most important diagnostic tools in clinical neurology and neurodiagnostic technology. Understanding how to read an EEG requires familiarity with brain wave frequencies, electrode placement, amplitude measurements, and the ability to distinguish normal activity from pathological patterns. Whether you are a student preparing for board certification or a curious patient reviewing your own results, mastering EEG interpretation is a skill built through systematic study and practice.
The EEG test works by recording the electrical activity of the brain through small metal electrodes attached to the scalp. These electrodes detect voltage fluctuations produced by the synchronized firing of large populations of neurons. The signals are amplified, filtered, and displayed as a series of waveforms on paper or a digital screen. Each channel on the recording represents the difference in electrical potential between two electrode sites, giving the reader a spatial map of brain activity across multiple regions simultaneously.
When clinicians and EEG technologists approach a recording, they evaluate several key parameters at once: the dominant background frequency, the symmetry between hemispheres, the presence or absence of normal sleep features, any abnormal discharges such as spikes or sharp waves, and the patient's state of alertness during the recording. Each of these elements contributes to a complete and accurate interpretation of what the brain is doing at any given moment during the study.
The eeg medical test is ordered for a wide range of indications, including suspected epilepsy, evaluation of loss of consciousness, assessment of encephalopathy, monitoring during neurosurgery, and confirmation of brain death. The specific clinical question being asked will guide what the interpreting physician or technologist focuses on during the review. A routine outpatient study lasting 20 to 40 minutes will be read differently than a 72-hour ambulatory recording or a continuous ICU monitoring session.
One of the most fundamental concepts in EEG reading is understanding the four primary frequency bands: delta (0.5–4 Hz), theta (4–8 Hz), alpha (8–13 Hz), and beta (13–30 Hz). Normal waking EEG in an adult is dominated by alpha rhythm over the posterior regions when the eyes are closed, transitioning to faster beta activity when the eyes open or when the patient is engaged in active mental processing. Slow delta and theta frequencies are normal during deep sleep but become abnormal markers of focal or diffuse dysfunction when seen in a fully awake adult.
Learning to read EEG also means understanding how to read an EEG in relation to similar tests — for instance, you should know how to read eeg alongside ECG tracings, since cardiac artifact is one of the most common sources of confusion in routine recordings. Artifact recognition is a critical competency: muscle artifact, electrode pop, 60 Hz interference, and movement can all mimic pathological waveforms if the reader is not vigilant. Experienced technologists develop pattern recognition for these imposters through years of exposure to varied recordings.
This comprehensive guide will walk you through every major aspect of EEG interpretation — from the standard 10-20 electrode system to recognizing epileptiform discharges, from understanding the cost of an EEG test to preparing for the neurodiagnostic credentialing examination. Whether you are studying for the CNIM, R.EEG.T., or CLTM credential, or simply want to understand what your neurologist is looking at, this article provides the structured knowledge you need to approach EEG reading with confidence and precision.
EEG Test by the Numbers
How to Read an EEG: Step-by-Step Interpretation Process
Verify Technical Quality
Identify the Background Rhythm
Assess Symmetry and Continuity
Identify Sleep Features (If Present)
Search for Epileptiform Activity
Correlate Findings with Clinical History
Understanding the four principal frequency bands is the foundation of every EEG interpretation. Delta activity spans 0.5 to 4 Hz and represents the slowest oscillations recorded from the scalp. In healthy adults, delta is normally present only during stage 3 non-REM sleep. When delta appears in an awake adult — particularly in a focal distribution over one hemisphere — it strongly suggests a structural lesion such as a tumor, infarct, abscess, or contusion in the underlying cortex. Diffuse delta slowing points toward a metabolic or toxic encephalopathy affecting the entire brain.
Theta activity ranges from 4 to 8 Hz and occupies the middle ground between slow and normal waking frequencies. Like delta, theta is expected during drowsiness and light sleep in adults and is a normal feature of the developing brain in children. Mild theta intermixed with alpha is common in elderly patients and in states of low alertness. However, persistent focal theta over one hemisphere or lobe warrants the same concern as focal delta: it suggests that region of cortex is not functioning normally and may overlie a structural or functional abnormality.
Alpha rhythm, spanning 8 to 13 Hz, is the hallmark of the normal, relaxed, awake adult brain. The posterior dominant rhythm — the alpha rhythm seen over the occipital and parietal regions — should be present when the patient is awake and resting with eyes closed, and it should attenuate (reduce in amplitude) promptly when the eyes open.
This reactivity to eye opening is itself a clinically important sign: a posterior dominant rhythm that fails to react to eye opening may indicate cortical dysfunction. The normal alpha frequency in adults is 9 to 11 Hz, and frequencies consistently below 8 Hz in an awake adult are considered abnormally slow.
Beta activity, defined as frequencies above 13 Hz, is normally distributed over the frontal and central regions and tends to increase with mental activity, anxiety, and the use of sedative medications such as benzodiazepines and barbiturates. Diffuse beta augmentation is one of the most common abnormal findings in routine EEGs and almost always reflects medication effect rather than primary brain pathology. Focal beta asymmetry, however, can be a lateralizing sign: a persistent amplitude decrease of beta over one hemisphere may indicate underlying cortical damage or the presence of a subdural collection between the scalp and cortex.
Beyond these four traditional bands, experienced EEG readers are also attentive to gamma oscillations (above 30 Hz), which require specialized high-frequency filters to record accurately. Gamma activity is increasingly recognized as important in higher cognitive functions and has pathological significance in certain epilepsy syndromes. At the other end of the spectrum, infraslow activity below 0.1 Hz is a topic of growing research interest but is not routinely assessed in standard clinical recordings due to electrode and filter limitations.
Amplitude is another critical dimension of EEG interpretation that complements frequency analysis. Normal EEG amplitudes in adults typically range from 10 to 100 microvolts depending on the channel and the patient's state. Very low-voltage recordings (under 20 µV throughout) may reflect a thick skull, scalp edema, widespread cortical damage, or medication suppression. Abnormally high amplitudes can be seen in children, in certain epilepsy syndromes like hypsarrhythmia, and as a focal finding over areas of cortical irritability. Recognizing what is within the normal amplitude range for a given patient age and clinical context is a skill that develops with experience.
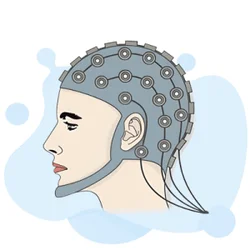
Electrode placement follows the international 10-20 system, which provides standardized positions based on measurements from four skull landmarks: the nasion, inion, and the two preauricular points. The system ensures that the same 19 standard electrode positions can be reproduced reliably across patients and recording centers worldwide.
Each electrode is labeled with a letter indicating the brain region (Fp = frontopolar, F = frontal, C = central, P = parietal, O = occipital, T = temporal) and a number indicating laterality (odd numbers = left hemisphere, even numbers = right hemisphere, z = midline). This systematic naming convention is essential for accurately localizing abnormalities in the written report.
Normal vs. Abnormal EEG Patterns: What the EEG Medical Test Reveals
Normal adult EEG during relaxed wakefulness shows a well-organized posterior dominant alpha rhythm at 9–11 Hz that attenuates with eye opening. Frontal beta activity at 18–25 Hz is typical and often enhanced by sedative medications. During drowsiness, the alpha slows and theta emerges, accompanied by slow rolling eye movements. Vertex sharp waves appear at the transition to stage 1 sleep and are completely normal physiological features, not pathological discharges.
Stage 2 sleep is characterized by sleep spindles (12–14 Hz bursts lasting 0.5–2 seconds) and K-complexes (high-amplitude biphasic waves maximal at the vertex). Slow-wave sleep shows continuous high-amplitude delta activity diffusely. Normal variants such as 14-and-6 Hz positive bursts, wicket spikes, and small sharp spikes of sleep (SSSS) are frequently encountered and must be recognized to avoid false-positive epilepsy diagnoses. Misidentifying these benign patterns as epileptiform is one of the most common errors in clinical EEG reading.
Benefits and Limitations of the EEG Test
- +Noninvasive procedure with no radiation exposure and no known side effects
- +Provides real-time, millisecond-resolution data on brain electrical activity
- +Highly sensitive for detecting epileptiform activity and seizures
- +Ambulatory and portable systems allow long-term recording in natural settings
- +Relatively low eeg test cost compared to MRI or PET scans for many indications
- +Can confirm or support the diagnosis of epilepsy, encephalopathy, and brain death
- −A single routine EEG captures only 20–40 minutes of brain activity, missing infrequent events
- −Normal EEG does not rule out epilepsy — sensitivity for a single study is roughly 50%
- −Requires patient cooperation; movement and muscle artifact can significantly degrade quality
- −Does not directly image brain structure — must be combined with MRI for complete evaluation
- −Interpretation requires specialized training; inter-rater variability exists even among experts
- −Eeg test side effects are rare but can include mild scalp irritation from electrode gel
EEG Interpretation Checklist: What to Review on Every Recording
- ✓Verify electrode placement follows the 10-20 system and all impedances are under 5 kΩ
- ✓Confirm filter settings: low-frequency filter at 1 Hz, high-frequency filter at 70 Hz
- ✓Identify and document the patient's state of alertness at each point in the recording
- ✓Characterize the posterior dominant rhythm: frequency, amplitude, symmetry, and reactivity to eye opening
- ✓Assess the interhemispheric symmetry of background frequencies and amplitudes
- ✓Document all normal sleep features present: vertex waves, spindles, K-complexes, and REM
- ✓Systematically scan every epoch for epileptiform discharges and note morphology and location
- ✓Identify and exclude artifact before classifying any potential abnormality as cerebral
- ✓Note the effects of activation procedures: hyperventilation response and photic driving
- ✓Correlate all findings with the patient's age, medications, and clinical indication for the test
The Posterior Dominant Rhythm Is Your Most Important Landmark
In any adult EEG, the first thing to assess is the posterior dominant rhythm during relaxed wakefulness with eyes closed. A well-formed, reactive alpha rhythm at 9–11 Hz is the strongest single indicator of a normal recording. If it is absent, slowed, asymmetric, or unreactive, that finding alone warrants clinical attention and sets the context for interpreting everything else in the record.
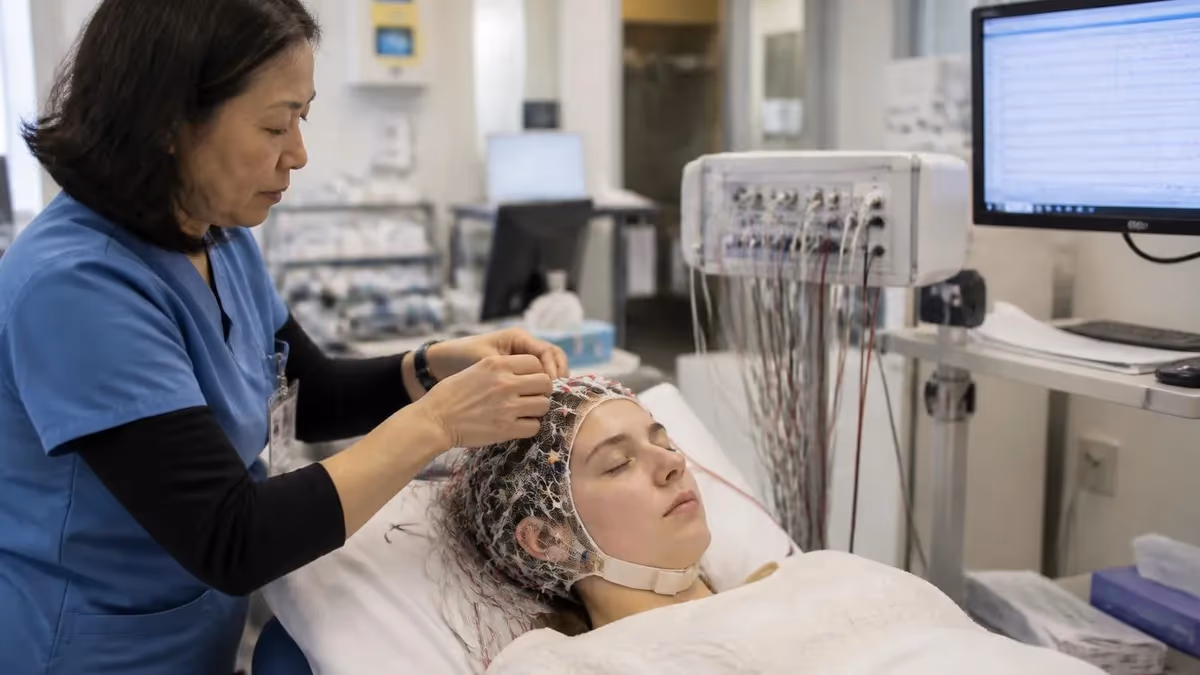
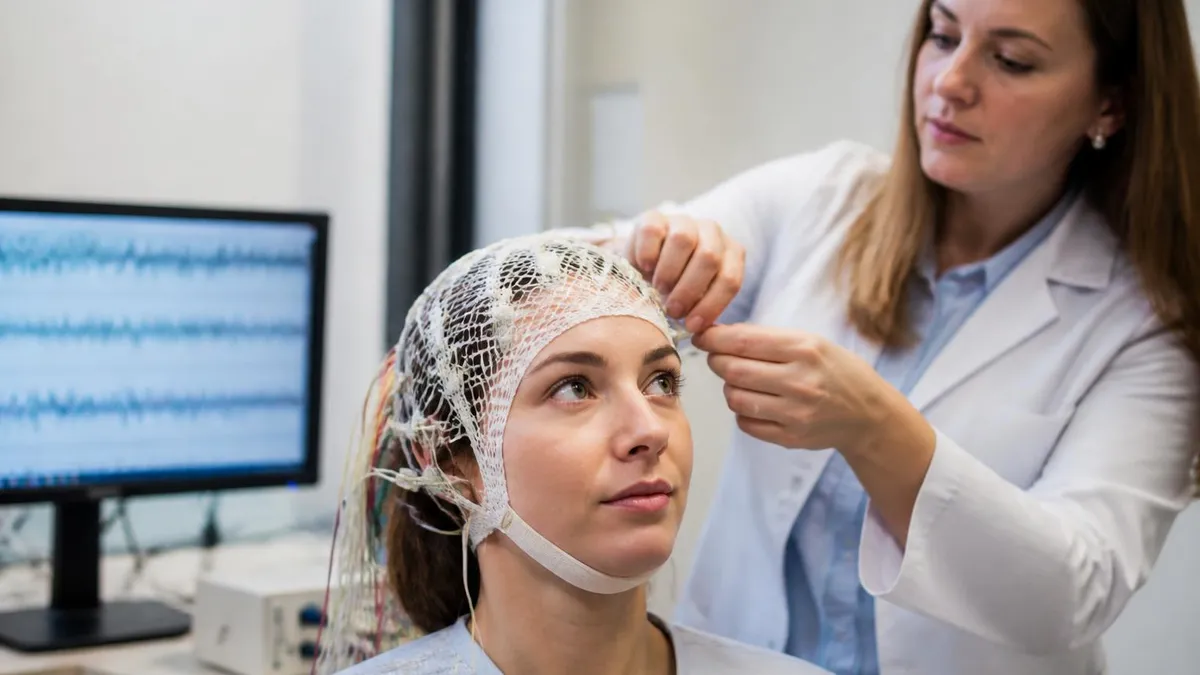
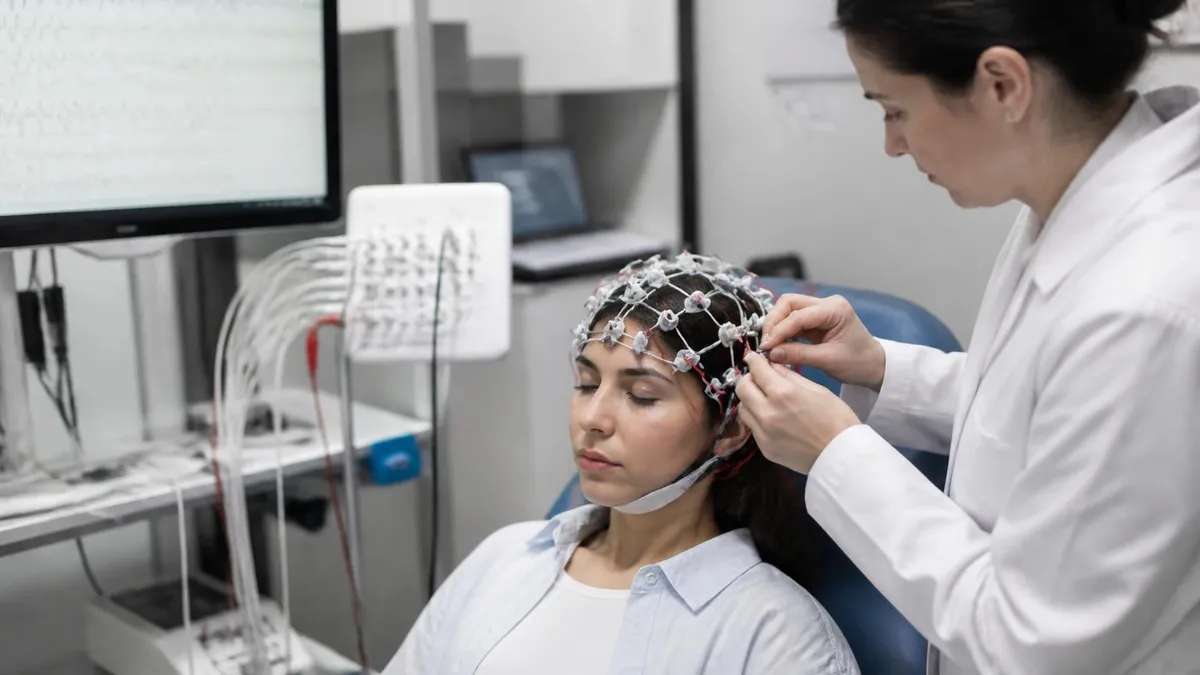
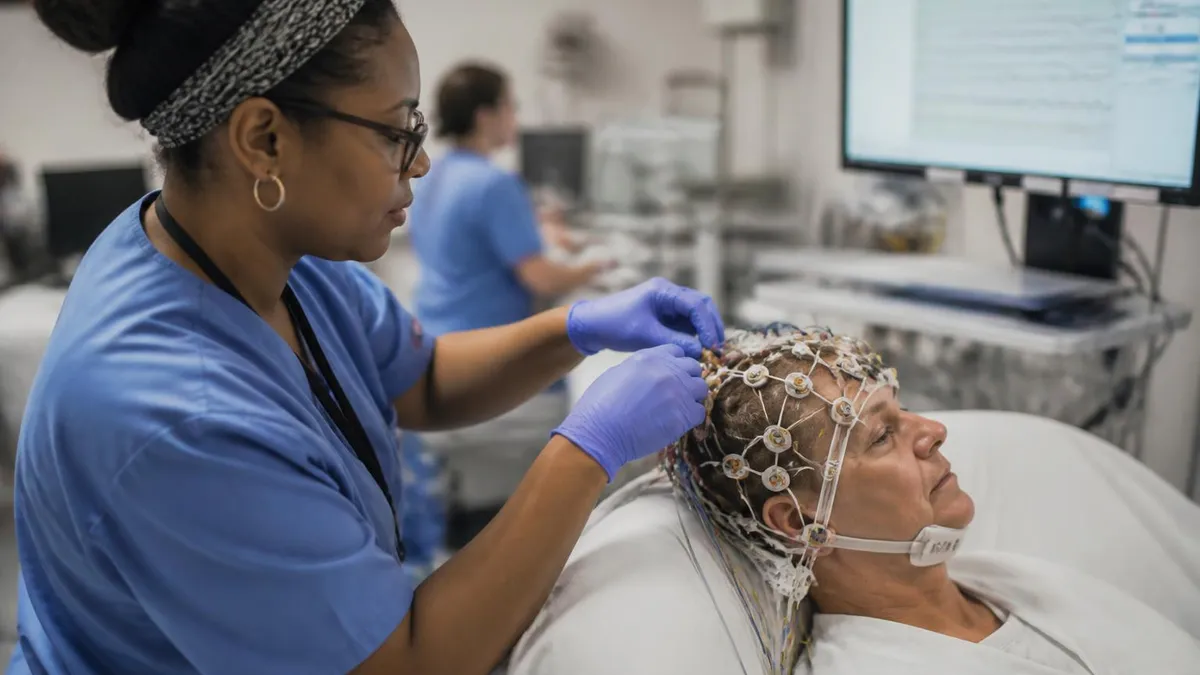
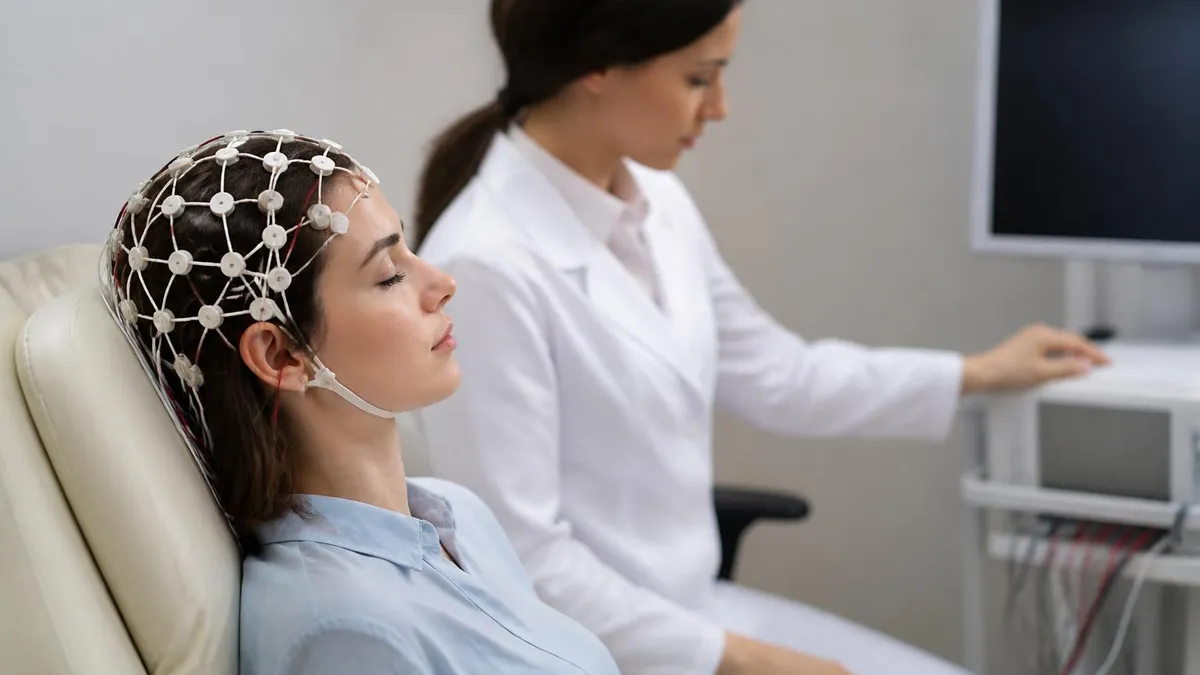
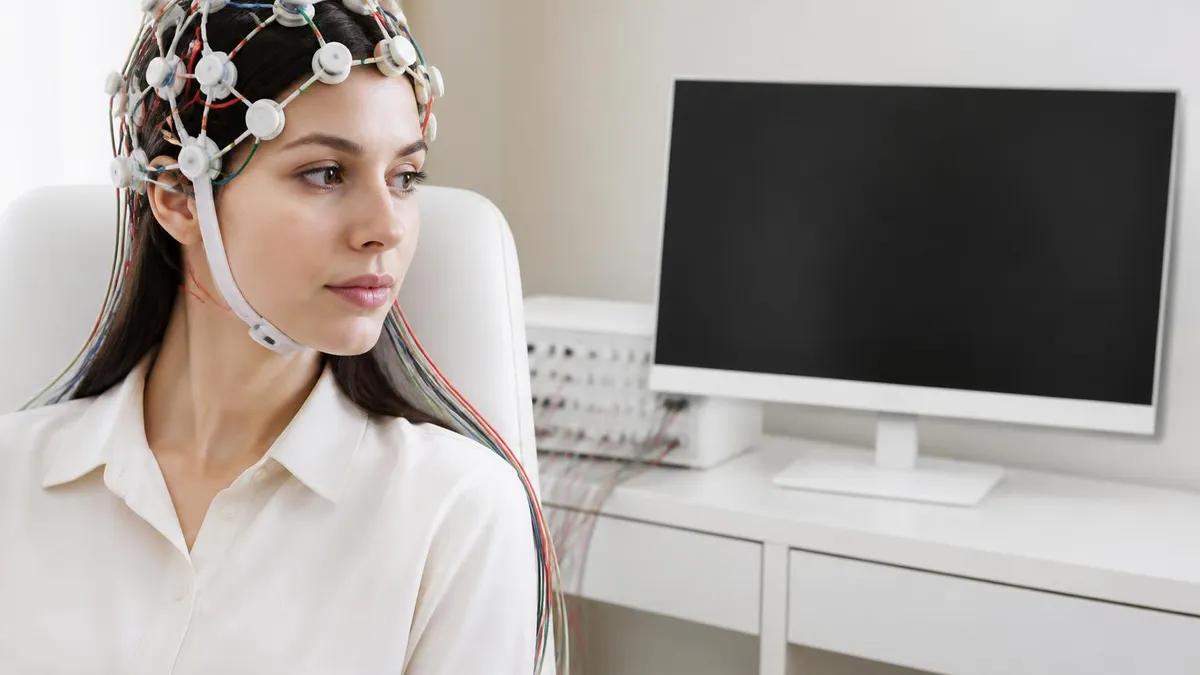
Understanding the practical details of the EEG test procedure helps both patients and technologists approach the study with appropriate expectations. A routine outpatient EEG begins with the patient sitting or lying down while the technologist applies 19 to 25 electrodes to the scalp using a conductive gel or paste. The electrode application process takes approximately 20 to 30 minutes and is entirely painless. Patients are asked to relax, keep their eyes closed when instructed, and avoid unnecessary movement to minimize artifact contamination of the recording.
The actual recording phase of a standard EEG lasts approximately 20 to 40 minutes. During this time, the technologist will perform activation procedures designed to provoke abnormal activity that might not be visible in the resting state. Hyperventilation is performed for three minutes and can produce diffuse slowing in normal subjects, with more dramatic responses in patients with certain epilepsy syndromes such as childhood absence epilepsy. Photic stimulation with a strobe light at frequencies ranging from 1 to 30 Hz tests for photoparoxysmal responses, which are markers of generalized epilepsy syndromes.
A question many patients ask is: how long is an EEG test from start to finish, including preparation and cleanup? The total appointment time is typically 60 to 90 minutes for a routine study, even though the actual recording is shorter. Extended EEG studies, such as video-EEG monitoring for seizure localization prior to epilepsy surgery, can last from 24 hours to several weeks. Ambulatory EEG recordings, performed with a portable device similar to a Holter monitor for the brain, typically run for 24 to 72 hours and capture the patient's normal daily activities and sleep cycles at home.
The eeg test price varies considerably depending on the type of study, the geographic region, the facility type, and whether the patient has insurance coverage. A routine outpatient EEG in the United States typically costs between $1,000 and $3,000 for the professional and technical components combined. However, after insurance negotiation, out-of-pocket eeg test cost for insured patients is often between $100 and $500. Uninsured patients or those seeking cash-pay pricing may find significant variation, with some community clinics offering studies for $200 to $600. Extended video-EEG monitoring can cost $5,000 to $20,000 or more for inpatient stays.
Eeg test side effects are minimal and primarily limited to minor scalp irritation from the electrode gel, which washes out with normal shampooing. Occasionally, hyperventilation during the study produces lightheadedness, tingling in the extremities, or a brief feeling of faintness — all of which resolve immediately when breathing returns to normal. There are no radiation risks, no injections, and no recovery time required. Patients can drive themselves home and return to all normal activities immediately after the study, making the EEG one of the most patient-friendly diagnostic tests in neurology.
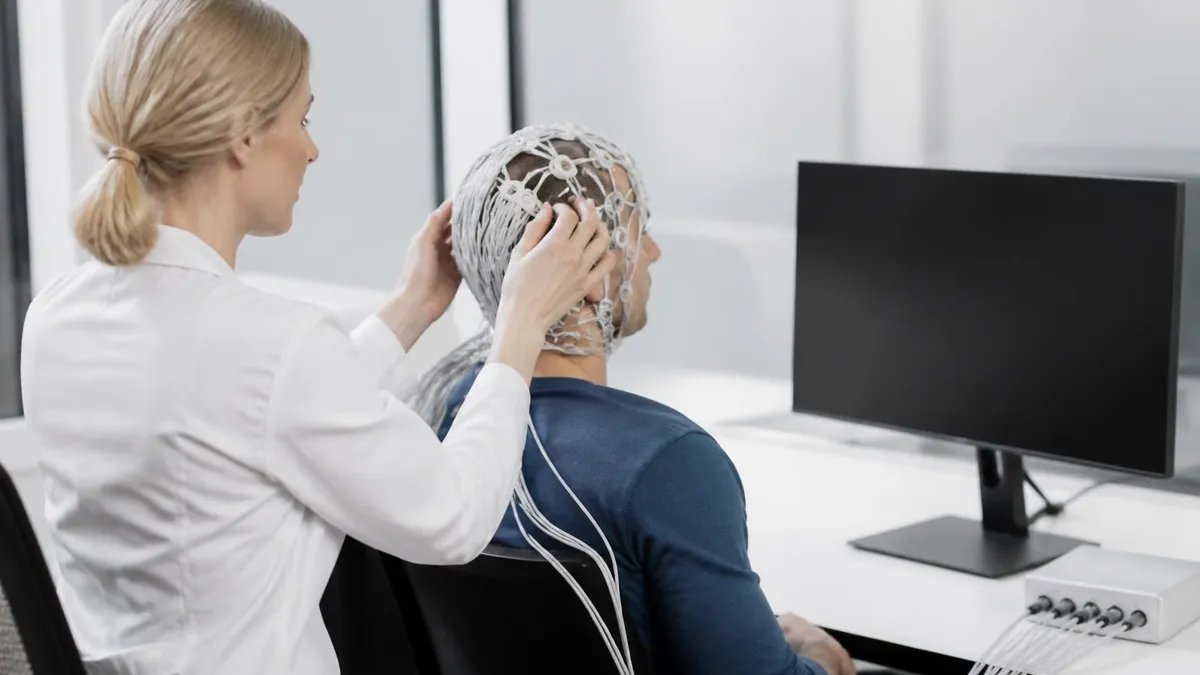
The clinical interpretation of an EEG is performed by a board-certified neurologist or clinical neurophysiologist who reviews the recording — either in real time or from a stored digital file — and produces a written report summarizing the findings. In teaching hospitals and large EEG laboratories, electroencephalographic technologists (R.EEG.T. credentialed professionals) perform the technical aspects of the recording and may provide a preliminary technical interpretation, while the physician provides the final clinical interpretation. The division of labor between technologist and physician is an important aspect of understanding the EEG test workflow.
Digital EEG systems have largely replaced paper-based recordings and offer significant advantages for interpretation: the reader can retrospectively change the montage (the way electrodes are grouped and compared), adjust sensitivity settings, apply digital filters, and measure waveform parameters with pixel-level precision.
Bipolar montages, in which adjacent electrodes are compared in chains, are useful for localizing focal abnormalities using phase reversal — the point where a discharge appears to originate based on the polarity flip. Referential montages, in which each electrode is compared to a common reference, are better for assessing the true amplitude and field of an abnormality across the entire scalp simultaneously.
Approximately 50% of patients with confirmed epilepsy will have a normal routine EEG on their first study. This is because interictal (between-seizure) epileptiform activity is intermittent, and a 20-minute recording captures only a brief window of brain activity. If clinical suspicion for epilepsy is high and the initial EEG is normal, a neurologist may recommend repeat EEG with sleep deprivation, prolonged ambulatory recording, or inpatient video-EEG monitoring before concluding the EEG is truly negative.
Preparing to work as a certified EEG technologist in the United States requires completing an accredited neurodiagnostic technology program, gaining supervised clinical experience, and passing the credentialing examination administered by the American Board of Registration of Electroencephalographic and Evoked Potential Technologists (ABRET). The primary credential for EEG technologists is the R.EEG.T. (Registered EEG Technologist), which requires candidates to demonstrate competency in recording technique, patient care, artifact recognition, and basic EEG interpretation. Advanced credentials include the CNIM (Certified Neurophysiologic Intraoperative Monitoring) and CLTM (Certified Long-Term Monitoring Technologist).
The examination content for the R.EEG.T. credential covers a broad range of topics that map directly to the skills required to read and record high-quality EEGs. These topics include the fundamentals of electronics and instrumentation, the 10-20 electrode system, montage construction, normal EEG patterns across the lifespan, abnormal patterns and their clinical significance, activation procedures, artifact identification, patient safety, and infection control. Candidates are expected to recognize waveforms from reproduced EEG samples and to apply their knowledge of neuroanatomy and neurophysiology to interpret what those waveforms mean clinically.
Structured study is essential for examination success. Most credentialing candidates benefit from a combination of textbook reading, practice question banks, and direct review of annotated EEG recordings. The Atlas of EEG Patterns by Stern and Engel and the text Clinical Electroencephalography by Ebersole, Husain, and Nordli are standard references for examination preparation. Online resources, including video libraries of annotated EEG recordings, have become increasingly valuable study tools and allow candidates to see patterns in motion rather than just static printed reproductions.
Practice examinations are one of the most effective preparation strategies available to candidates. Working through hundreds of practice questions under timed conditions builds both content knowledge and test-taking stamina. Practice questions help candidates identify their weak areas so they can focus their remaining study time most efficiently. Reviewing the rationale for both correct and incorrect answers after each practice session deepens understanding and reduces the likelihood of making the same error twice. Most candidates who pass the R.EEG.T. examination on their first attempt report completing at least 500 to 1,000 practice questions during their preparation period.
Understanding EEG in the context of related neurodiagnostic modalities also strengthens a technologist's overall competency. Familiarity with evoked potentials, nerve conduction studies, and intraoperative monitoring expands the range of clinical settings where a technologist can contribute. Many hospital-based neurodiagnostic departments expect their staff to rotate through multiple modalities, so breadth of knowledge is professionally advantageous. The ABRET offers separate credentials for each modality, and many experienced technologists ultimately hold two or three credentials over the course of their career.
Continuing education is required to maintain ABRET credentials and ensures that credentialed technologists remain current with evolving standards of practice. The field of clinical neurophysiology is not static: new consensus guidelines for EEG terminology, updated recommendations for ICU monitoring, and advances in high-density EEG and source localization are continuously published by the American Clinical Neurophysiology Society (ACNS). Staying current with these developments is part of the professional responsibility of every credentialed neurodiagnostic technologist working in the modern clinical environment.
For those who want to deepen their understanding of related diagnostic tests, it is worth exploring how EEG compares to cardiac monitoring. Learning about how to read eeg in comparison with ECG tracings clarifies the distinct technical and clinical contexts of each modality. While both tests record bioelectrical signals through surface electrodes, they measure fundamentally different physiological systems and require entirely different interpretive frameworks. This cross-modality awareness reduces confusion and strengthens a technologist's ability to communicate clearly with neurologists, cardiologists, and other members of the clinical team.
Mastering EEG interpretation is not a passive activity — it requires deliberate, repeated practice with a wide variety of recordings from patients of different ages, clinical presentations, and levels of alertness. The most effective way to develop pattern recognition is to review annotated EEG recordings while simultaneously reading explanations of each finding. Starting with clearly abnormal recordings makes it easier to internalize the key features of epileptiform discharges before moving on to more subtle findings and ambiguous patterns near the boundary of normal and abnormal.
One practical strategy for self-directed learners is to study EEG using a systematic regional approach. Rather than scanning randomly, train yourself to evaluate the posterior regions first (for the posterior dominant rhythm), then the frontal regions (for expected beta and absence of abnormal slowing), then the temporal regions (the most common site of focal epileptiform activity in adults), and finally the vertex and central regions (for normal sleep features and central mu rhythm). This systematic approach prevents important findings from being overlooked and builds an organized mental framework that becomes increasingly automatic with practice.
Understanding activation procedures deepens EEG reading skill in both technical and clinical dimensions. Hyperventilation-induced buildup of diffuse theta and delta activity is expected in children and young adults and should not be over-interpreted. The buildup is symmetric, diffuse, and reversible within 90 seconds of stopping hyperventilation. Persistence of focal slowing beyond this recovery window, or the appearance of epileptiform discharges only during hyperventilation, carries clinical significance. For photic stimulation, the reader must distinguish normal photic driving — entrainment of posterior occipital activity at the flash frequency — from photoparoxysmal responses, which are generalized epileptiform discharges triggered by the strobe.
Ambulatory EEG interpretation introduces additional complexity because the recording environment is uncontrolled, artifact is more prevalent, and the total data volume is much larger — up to 72 hours of continuous recording must be reviewed efficiently. Most modern ambulatory EEG systems include automated seizure detection algorithms and event markers placed by the patient or caregiver using a button on the recorder.
These markers guide the interpreter toward periods of clinical interest, but a thorough review still requires evaluating background activity across the entire recording to detect subtle changes that the patient may not have noticed. Computer-assisted review tools can flag candidate abnormalities for human review, but they do not replace systematic human evaluation.
Neonatal EEG interpretation is a specialized subspecialty that requires knowledge of age-appropriate patterns from 24 weeks post-conceptional age through the first year of life. The neonatal EEG is dramatically different from the adult recording: the background is discontinuous in premature infants, becoming progressively more continuous as the brain matures.
Brushes, delta waves with superimposed fast activity, are normal in premature neonates but pathological if they persist past term age. Neonatal seizures are often subtle or subclinical and require EEG monitoring for detection. This developmental dimension of EEG adds another layer of expertise that candidates in pediatric or NICU-based programs must master.
Continuous EEG monitoring in the intensive care unit is one of the fastest-growing areas of clinical neurophysiology. ICU EEG is used to detect nonconvulsive seizures in critically ill patients who are comatose or pharmacologically sedated and cannot manifest overt convulsive movements. The ACNS has developed a standardized terminology for critical care EEG that allows clinicians to communicate findings in a precise, reproducible way. Key parameters in this system include the background continuity, voltage, dominant frequency, presence of periodic discharges, and seizure burden. Familiarity with this terminology is increasingly expected of technologists and physicians working in neurological and medical ICU settings.
Finally, the best advice for anyone learning to read EEG is to embrace uncertainty rather than force premature conclusions. Experienced readers regularly encounter recordings where the distinction between a benign variant and a pathological finding is genuinely ambiguous. In these cases, the appropriate response is to describe what you see accurately, note the uncertainty, and recommend clinical correlation or additional recording rather than committing to a false certainty. EEG interpretation is a probabilistic discipline that improves with humility, ongoing learning, and exposure to a broad and diverse caseload over a sustained career in neurodiagnostic technology.
EEG Questions and Answers
EEG vs ECG vs EKG: Brain and Heart Test Differences
EEG Electroencephalography Practice Test PDF (Free Printable 2026)

EEG Test Price: How Much Does an EEG Cost in 2026?
EEG Images: A Visual Guide to Brain Wave Patterns, Recordings, and Test Results
What Does an EEG Measure? Brain Waves, Electrical Activity, and What Your Results Reveal
About the Author

Educational Psychologist & Academic Test Preparation Expert
Columbia University Teachers CollegeDr. Lisa Patel holds a Doctorate in Education from Columbia University Teachers College and has spent 17 years researching standardized test design and academic assessment. She has developed preparation programs for SAT, ACT, GRE, LSAT, UCAT, and numerous professional licensing exams, helping students of all backgrounds achieve their target scores.