
How to Read an EEG Test: A Complete Guide to Brain Wave Patterns and Results
Learn how to read an EEG test — brain wave types, normal vs. abnormal patterns, cost, and what results mean. 🧠 Complete US guide.

An EEG test — short for electroencephalogram — is one of the most informative neurological studies available in modern medicine, yet the results can look like a sea of squiggly lines to anyone who hasn't been trained to interpret them. Learning how to read a EEG starts with understanding that each wave on the printout represents the collective electrical activity of millions of neurons firing in coordinated rhythms beneath the scalp electrodes. Neurologists and EEG technologists spend years mastering this skill, but patients and caregivers can benefit enormously from grasping the fundamentals of what those patterns actually mean.
The EEG medical test was first performed on a human being by Hans Berger in 1924, and it has remained the gold standard for evaluating brain electrical activity ever since. During the recording, between 19 and 256 electrodes are placed on the scalp according to a standardized map called the International 10-20 System. Each electrode picks up voltage fluctuations measured in microvolts, and the amplifier converts those signals into the waveforms displayed on screen or printed on paper. The resulting multi-channel record is called a montage, and readers must learn to compare channels systematically rather than viewing each in isolation.
Before diving into wave morphology, it helps to understand why patients undergo this what is EEG test evaluation in the first place. The most common indications include suspected epilepsy or seizure disorders, unexplained loss of consciousness, encephalopathy workup, sleep disorders, and monitoring of patients in intensive care units. Each clinical question shapes what the reader is looking for: epilepsy evaluation demands careful scrutiny for interictal epileptiform discharges, while an ICU study might focus on background slowing or burst-suppression patterns that signal metabolic or hypoxic injury.
The fundamental building blocks of EEG interpretation are frequency bands. Brain waves are classified by how many complete cycles occur per second, measured in Hertz (Hz). The four classic bands are delta (0.5–4 Hz), theta (4–8 Hz), alpha (8–13 Hz), and beta (13–30 Hz), with gamma above 30 Hz gaining increasing clinical interest. A normal awake adult resting with eyes closed should show a dominant alpha rhythm over the posterior head regions, typically between 9 and 11 Hz. When the eyes open, this alpha rhythm attenuates — a phenomenon called alpha blocking — and lower-amplitude faster beta activity takes over.
Amplitude is the second key dimension of EEG reading. Most normal background rhythms measure between 20 and 100 microvolts, though there is considerable inter-individual variability. Abnormally high-amplitude slow activity suggests cortical dysfunction, while diffusely low-voltage records can be seen in certain metabolic conditions or after cardiac arrest. Readers must always compare the two hemispheres: a persistent amplitude asymmetry of greater than 50 percent between homologous electrode pairs is generally considered clinically significant and warrants further investigation for structural lesions like tumors or subdural hematomas.
Morphology — the actual shape of individual waveforms — is the third pillar of EEG analysis. Certain waveforms have highly distinctive shapes that carry diagnostic weight. Spike-and-wave complexes, sharp waves, and polyspike discharges are examples of epileptiform activity, each with its own implication for seizure type and syndrome classification. Sleep architecture introduces additional normal waveforms such as sleep spindles, K-complexes, and vertex waves that must be recognized and not mistaken for pathology. Reading a full overnight sleep EEG therefore requires knowledge of both pathological and normal developmental waveforms across different sleep stages.
For those preparing for the ABRET credentialing examination or simply wanting to sharpen their clinical knowledge, understanding the interplay of frequency, amplitude, and morphology is essential. You can also explore how EEG compares to cardiac monitoring by reading our article on how to read an eeg versus ECG and EKG testing — a comparison that clarifies the unique role each test plays in diagnosing different organ systems. With a solid conceptual foundation in place, every subsequent section of this guide will build your ability to approach a real tracing with confidence and clinical precision.
EEG Test by the Numbers

How to Read an EEG: Step-by-Step Process
Verify Technical Quality
Identify the Background Rhythm
Assess Frequency Bands
Scan for Epileptiform Activity
Review Sleep Architecture (If Applicable)
Synthesize and Report Findings
Understanding what constitutes a normal EEG is just as important as recognizing pathology, because many normal variants are frequently mistaken for epileptiform activity by the inexperienced reader. The most commonly misidentified benign variants include wicket spikes, small sharp spikes (also called benign epileptiform transients of sleep), 14-and-6 positive bursts, and subclinical rhythmic electrographic discharge in adults (SREDA). Each of these patterns has specific morphological and contextual features that distinguish it from true epileptiform discharges, and failing to recognize them can lead to an incorrect diagnosis of epilepsy with serious consequences for the patient.
Wicket spikes appear as arciform (arch-shaped) waveforms predominantly over the temporal regions during drowsiness or light sleep. Unlike true temporal lobe spikes, they occur in runs that look like a wicket fence, have no aftergoing slow wave, and appear identical to fragments of the ongoing background mu-like rhythm. Their amplitude typically ranges from 60 to 200 microvolts, and they are seen bilaterally though often asymmetrically. Correctly identifying wicket spikes prevents unnecessary antiepileptic drug prescriptions in patients who may simply have this normal variant pattern.
True abnormalities in the EEG medical test fall into two broad categories: epileptiform and non-epileptiform. Epileptiform abnormalities include interictal epileptiform discharges (IEDs) such as spikes and sharp waves, as well as ictal patterns representing ongoing seizures. Non-epileptiform abnormalities include background slowing, asymmetries, periodic patterns, and findings consistent with specific encephalopathic states. Background slowing is the most common EEG abnormality overall, reflecting diffuse or focal cerebral dysfunction without necessarily indicating a seizure disorder — it can be caused by medications, metabolic disturbances, infections, or structural lesions.
Focal slowing — excess delta or theta activity localized to one brain region — is particularly important because it often indicates a structural lesion in that area. When a reader identifies persistent focal slowing over the left temporal region, for example, the differential diagnosis includes tumor, stroke, contusion, or gliosis from prior injury. The slowing may be intermittent or continuous, and continuous focal slowing generally indicates more severe underlying pathology. MRI correlation is almost always required to determine the structural basis for focal EEG changes.
Periodic patterns deserve special mention because they represent a fascinating and diagnostically rich area of EEG interpretation. The most well-known periodic pattern is the triphasic wave, historically associated with hepatic encephalopathy but now understood to occur in a wide range of metabolic encephalopathies. Triphasic waves are characterized by three phases: a small initial negative deflection, a large positive deflection, and a second negative deflection, occurring at 1–2.5 Hz. Another critical periodic pattern is the periodic lateralized epileptiform discharge (PLED), now called LPD (lateralized periodic discharge), strongly associated with acute focal brain injury and a high risk of clinical seizures.
Burst-suppression is perhaps the most ominous pattern encountered in the ICU setting. It consists of alternating periods of high-amplitude mixed-frequency activity (bursts) separated by periods of electrocerebral silence (suppression). Burst-suppression can be induced intentionally with high doses of anesthetic agents for refractory status epilepticus, but when seen spontaneously it reflects severe diffuse cortical dysfunction and carries a grave prognosis. The ratio of burst duration to suppression duration and the presence or absence of ictal activity within the bursts are both prognostically important features that the reader must document carefully.
For those preparing to demonstrate competency in EEG interpretation, grasping these distinctions between normal variants and true abnormalities forms the bedrock of clinical credentialing. The ABRET R. EEG T. examination tests candidates extensively on pattern recognition across all categories described above. Practicing with realistic EEG tracings and working through detailed case-based questions is the most efficient pathway to building the rapid pattern recognition that expert readers employ. Reviewing our guide on how to read an eeg alongside cardiac monitoring studies also helps contextualize what brain-specific wave morphology looks like compared to cardiac electrical signals.
What Is an EEG Medical Test: Reading by Clinical Scenario
When an EEG test is ordered to evaluate for epilepsy, the reader focuses intensely on identifying interictal epileptiform discharges (IEDs). These discharges — spikes, sharp waves, or spike-and-slow-wave complexes — represent the electrical signature of an irritable cortex capable of generating seizures. Their location helps classify the epilepsy syndrome: generalized 3 Hz spike-and-wave strongly suggests childhood absence epilepsy, while left temporal spikes point toward temporal lobe epilepsy, the most common focal epilepsy in adults.
Activation procedures such as hyperventilation and photic stimulation are routinely performed during epilepsy EEGs to provoke latent epileptiform activity. Hyperventilation for three minutes induces hypocapnia and cerebral vasoconstriction, reliably activating absence seizures in susceptible patients. Photic stimulation at frequencies between 1 and 30 Hz can trigger photoparoxysmal responses — generalized spike-wave bursts time-locked to the flash — in photosensitive individuals. Sleep deprivation before the study further increases the yield of epileptiform abnormalities by approximately 30 percent compared to a routine awake-only recording.

EEG Test Advantages and Limitations
- +Non-invasive procedure with no radiation exposure, making it safe for all ages including neonates
- +Excellent temporal resolution — captures brain electrical events occurring within milliseconds
- +Relatively low EEG test cost compared to MRI or PET scanning for initial neurological workup
- +Portable bedside units enable monitoring of critically ill patients in the ICU
- +Ambulatory systems allow recording during typical daily activities and natural sleep
- +Provides real-time ictal onset localization crucial for surgical epilepsy planning
- −Poor spatial resolution — scalp electrodes cannot precisely localize deep subcortical sources
- −Standard 20–40 minute study has low sensitivity if seizures or IEDs are infrequent
- −Movement, muscle, and electrode artifact can obscure or mimic genuine brain activity
- −Interpretation is highly operator-dependent and requires years of specialized training
- −A normal EEG does not rule out epilepsy — up to 10 percent of epilepsy patients have normal interictal EEGs
- −EEG test side effects from electrode gel may include minor skin irritation or temporary scalp redness
EEG Reading Checklist: 10 Steps for Systematic Interpretation
- ✓Verify electrode placement matches the 10-20 system and all impedances are below 5 kΩ before beginning interpretation.
- ✓Identify and document the predominant state of the patient (awake, drowsy, asleep, or unresponsive) throughout the recording.
- ✓Determine the posterior dominant rhythm (PDR) frequency, amplitude, and reactivity to eye opening and closure.
- ✓Assess each frequency band (delta, theta, alpha, beta) for normal proportion, distribution, and symmetry between hemispheres.
- ✓Scan every channel for epileptiform transients — note morphology, polarity, field, frequency of occurrence, and any evolution.
- ✓Identify and characterize any periodic patterns using ACNS standardized terminology (GPD, LPD, GPFA, etc.).
- ✓Recognize and exclude normal variants (wicket spikes, small sharp spikes, SREDA) from true epileptiform abnormalities.
- ✓Document normal sleep architecture elements (vertex waves, spindles, K-complexes) if sleep is captured in the recording.
- ✓Note all artifacts and explain their source — this protects against misinterpretation of muscle, electrode, or ECG artifact.
- ✓Correlate all EEG findings with patient age, clinical diagnosis, medications, and sedation level before writing the final report.
A Normal EEG Does NOT Rule Out Epilepsy
Up to 50 percent of patients with confirmed epilepsy have a normal first routine EEG. The probability of capturing an interictal epileptiform discharge increases with each subsequent study, reaching approximately 90 percent sensitivity after three separate recordings combined with sleep deprivation. Always interpret EEG findings in the full clinical context — never diagnose or exclude epilepsy based on a single normal result.
The EEG test cost in the United States varies considerably depending on the type of study ordered, the facility performing it, and whether the patient has health insurance coverage. A standard outpatient routine EEG typically costs between $200 and $700 at the facility level, but the total bill including physician interpretation fees and facility charges can reach $1,000 to $3,000 when performed at a hospital outpatient department.
EEG test price for extended recordings is substantially higher: a 24-hour ambulatory EEG averages $1,500 to $4,000, while long-term video-EEG monitoring in an epilepsy monitoring unit can cost $5,000 to $20,000 or more per admission, depending on the length of stay required to capture a typical event.
Insurance coverage for EEG testing is generally strong when the study is medically indicated. Medicare covers routine EEGs under CPT code 95816 (awake and drowsy) or 95819 (awake and asleep), with beneficiaries responsible for the standard 20 percent coinsurance after their deductible. Most private insurance plans cover diagnostic EEGs for established indications such as seizure evaluation, encephalopathy workup, or sleep disorder assessment. Patients should always verify prior authorization requirements with their insurer before scheduling an extended or inpatient monitoring study, as these costlier services are more likely to require documentation of medical necessity.
For uninsured or underinsured patients, the EEG test cost out-of-pocket can be a significant barrier to care. Many academic medical centers and federally qualified health centers offer sliding-scale fees based on income. Some epilepsy foundations also maintain assistance programs that can help patients access necessary diagnostic testing. It is worth noting that telehealth neurology consultations have expanded access to EEG interpretation in rural areas, where traveling to a major epilepsy center for video-EEG monitoring was previously prohibitive both logistically and financially.
Regarding how long is an EEG test, the duration depends entirely on the study type. A routine outpatient EEG lasts 20 to 40 minutes from the time the patient is seated until the electrodes are removed, though the actual recording segment is typically 20 to 30 minutes. A sleep-deprived EEG adds sleep recording time and may last 60 to 90 minutes total.
An ambulatory EEG records continuously for 24 to 72 hours without interrupting the patient's daily routine. An inpatient video-EEG monitoring admission averages three to seven days, though it can extend to two weeks if the patient's events are infrequent.
Patients frequently ask about EEG test side effects before undergoing the procedure. The good news is that a standard EEG is extraordinarily safe and has essentially no direct side effects. The electrodes are applied with a conductive gel or paste and are not attached by needles — the most common complaint is that the gel can be difficult to wash out of the hair afterward.
Some patients experience mild scalp irritation at electrode sites, particularly after prolonged ambulatory recordings. The hyperventilation activation procedure may cause lightheadedness or tingling in the extremities during the three-minute effort, but these sensations resolve within seconds of stopping.
Photic stimulation is safe for the vast majority of patients, but in the rare individual with photosensitive epilepsy, the procedure can trigger a clinical seizure. For this reason, hyperventilation and photic stimulation are always performed under direct observation by a trained EEG technologist who is prepared to intervene immediately if a clinical event occurs. Contraindications to hyperventilation include recent stroke, sickle cell disease, and moyamoya disease, as the cerebral vasoconstriction induced by hypocapnia could worsen ischemia in these conditions. Any such contraindications should be communicated to the EEG lab before the appointment.
Understanding the cost structure and logistical realities of EEG testing empowers patients to advocate for themselves within the healthcare system. When a physician recommends an EEG, patients should feel comfortable asking which type of study is planned, what the expected duration will be, and what their out-of-pocket responsibility will be after insurance. For those seeking to understand the nuances of brain versus cardiac monitoring, our resource on how to read an eeg versus ECG provides essential context for how these different electrophysiological tests are interpreted by specialists in neurology and cardiology respectively.

Some patients believe that stopping antiepileptic drugs before an EEG will increase the chance of capturing abnormal activity. While medication reduction is sometimes performed in a supervised inpatient epilepsy monitoring unit setting, abruptly stopping seizure medications at home is dangerous and can precipitate prolonged seizures or status epilepticus. Always follow your neurologist's specific instructions regarding medications before any EEG study.
Preparing for the ABRET R. EEG T. credentialing examination requires a strategic and systematic approach to learning EEG interpretation that goes beyond simply reading textbooks. The exam tests not only pattern recognition but also understanding of the physiological basis for each waveform, the technical principles underlying signal acquisition and display, and the clinical correlations that make EEG findings meaningful. Candidates who pass on their first attempt almost universally cite consistent hands-on practice with real or simulated tracings as the single most important factor in their success.
The R. EEG T. examination contains 225 questions (200 scored, 25 unscored) covering EEG technology, instrumentation, clinical neurophysiology, patient care, and EEG pattern recognition. Candidates have four hours to complete the exam. The pass rate historically hovers around 55 to 65 percent for first-time takers, reflecting the genuine difficulty of mastering both the technical and clinical dimensions of the field. A minimum of one year of EEG laboratory experience working under a qualified supervisor is required before sitting for the examination, ensuring that all candidates have had meaningful exposure to real patient recordings.
Effective study strategies for EEG credentialing begin with a solid grounding in neuroanatomy and neurophysiology. Understanding why certain brain regions generate specific rhythms — why the thalamo-cortical circuits produce sleep spindles, why mesial temporal structures are prone to spiking in temporal lobe epilepsy, why metabolic insults produce diffuse slowing — transforms rote memorization into durable conceptual understanding. Candidates who understand the mechanisms behind EEG patterns can reason through unfamiliar cases rather than simply pattern-matching to memorized examples.
Spaced repetition is the most evidence-based method for retaining the large volume of factual information required for the exam. Using flashcard systems to review electrode placements, normal values by age, waveform definitions, and pharmacological effects on the EEG ensures that information is moved from short-term to long-term memory through systematic review intervals. Many successful candidates combine daily flashcard review with weekly full-length practice test sessions, carefully reviewing the explanations for every question — both correct and incorrect answers — to identify and close knowledge gaps.
Group study and peer discussion accelerate learning in ways that solo study cannot replicate. EEG reading clubs, where small groups review tracings together and discuss their interpretations, mimic the real-world process of inter-rater reliability development and expose each reader to colleagues' reasoning processes. Online communities of EEG technologists and neurophysiology trainees share difficult cases, discuss classification controversies, and provide encouragement through the challenging preparation period. The ABRET website also provides a detailed content outline that serves as the definitive blueprint for examination preparation.
Practice tests are perhaps the highest-yield component of exam preparation, both for their direct content value and for their ability to simulate the psychological experience of timed test-taking. Working through banks of EEG-specific practice questions exposes candidates to the precise level of clinical detail and conceptual nuance tested on the actual examination. After completing each practice session, candidates should spend at least as much time reviewing explanations as they spent answering questions — the review phase is where the majority of learning occurs, not the question-answering phase itself.
For EEG professionals and neurology trainees who want to deepen their understanding of how brain electrical activity compares to cardiac electrical activity — two fields that use similar terminology but measure completely different physiological phenomena — exploring our coverage of how to read an eeg alongside ECG and EKG testing reveals important distinctions in lead placement, waveform nomenclature, and clinical interpretation that every electrophysiology professional should understand. Building cross-domain knowledge strengthens overall clinical reasoning and improves performance across all areas of the credentialing examination.
Practical tips from experienced EEG readers consistently emphasize the importance of developing a systematic reading routine and sticking to it on every single tracing. Expert neurophysiologists do not scan a tracing randomly hoping to spot abnormalities — they follow the same structured sequence every time, evaluating background, frequency, amplitude, symmetry, and specific waveform features in a predetermined order. This systematic approach ensures that nothing is missed and that findings are documented in a consistent, clinically useful format that colleagues and referring physicians can rely upon.
One of the most valuable practical skills is learning to rapidly identify artifact and exclude it from clinical interpretation. Muscle artifact is the most common confound, appearing as high-frequency (above 30 Hz), irregular activity most prominent over the temporal and frontal regions where scalp muscles are thickest. Movement artifact produces large-amplitude slow deflections that shift all channels simultaneously.
ECG artifact creates a rhythmic spike recurring at the heart rate, and its presence in the EEG is confirmed by comparing the timing to a simultaneously recorded EKG channel. Electrode artifact — loose or broken electrode connections — produces distinctive large-amplitude sharp deflections limited to a single channel, which distinguishes it from genuine focal brain activity.
Learning to estimate frequency visually without relying solely on electronic measurements is another key practical skill. Experienced readers develop the ability to glance at a waveform and estimate whether it is occurring at 3, 6, 10, or 20 Hz by comparing the waveform duration to the time scale marker on the tracing. Standard EEG paper speed is 30 mm per second, so a wave occupying 10 mm on the tracing has a period of 333 milliseconds, corresponding to approximately 3 Hz. Practicing these mental calculations builds the speed necessary to work efficiently through long recordings under time pressure.
Documentation is an underappreciated but critical practical skill for EEG readers. A well-written EEG report communicates findings clearly to the ordering clinician, provides a permanent record for longitudinal comparison, and medicolegally documents what was observed and what was not. Reports should describe findings using standardized terminology, quantify abnormalities where possible (e.g., frequency of interictal discharges per hour), and explicitly state the clinical significance in the impression section. Vague or ambiguous reports that leave the ordering physician uncertain about clinical next steps fail the patient regardless of how accurate the underlying EEG interpretation may have been.
Correlation with prior EEG studies is invaluable in longitudinal care. A new finding of focal slowing is far more significant if it was absent on a study performed six months earlier, while persistent mild background slowing in a patient with known intellectual disability may represent their baseline rather than acute pathology. Always request prior EEG reports and tracings when available, and explicitly compare current findings to historical baselines in the report. This practice also helps identify whether previously identified epileptiform abnormalities are stable, improving, or worsening in response to medication adjustments.
Stay current with evolving classification systems and terminology, particularly the ACNS Critical Care EEG Terminology and the ILAE classification of epileptic seizures and syndromes. Both have been updated in recent years to reflect advances in understanding of ictal and interictal patterns, and examination questions increasingly reflect contemporary terminology rather than older nomenclature. Subscribing to the journal Clinical Neurophysiology and attending the American Epilepsy Society annual meeting are practical ways to stay current with developments in the field without requiring significant additional time investment.
Finally, develop comfort with uncertainty and with the limits of EEG as a diagnostic tool. Not every tracing will yield a clear answer, and experienced readers know when to say that a pattern is at the boundary between normal and abnormal, or that the clinical context is insufficient to determine the significance of a finding.
Overcalling epileptiform activity in ambiguous cases leads to unnecessary antiepileptic drug prescriptions and their associated side effects. Undercalling clearly epileptiform patterns delays treatment and puts patients at risk. Calibrating this judgment is a lifelong clinical skill that grows with experience and reflective practice on challenging cases.
EEG Questions and Answers
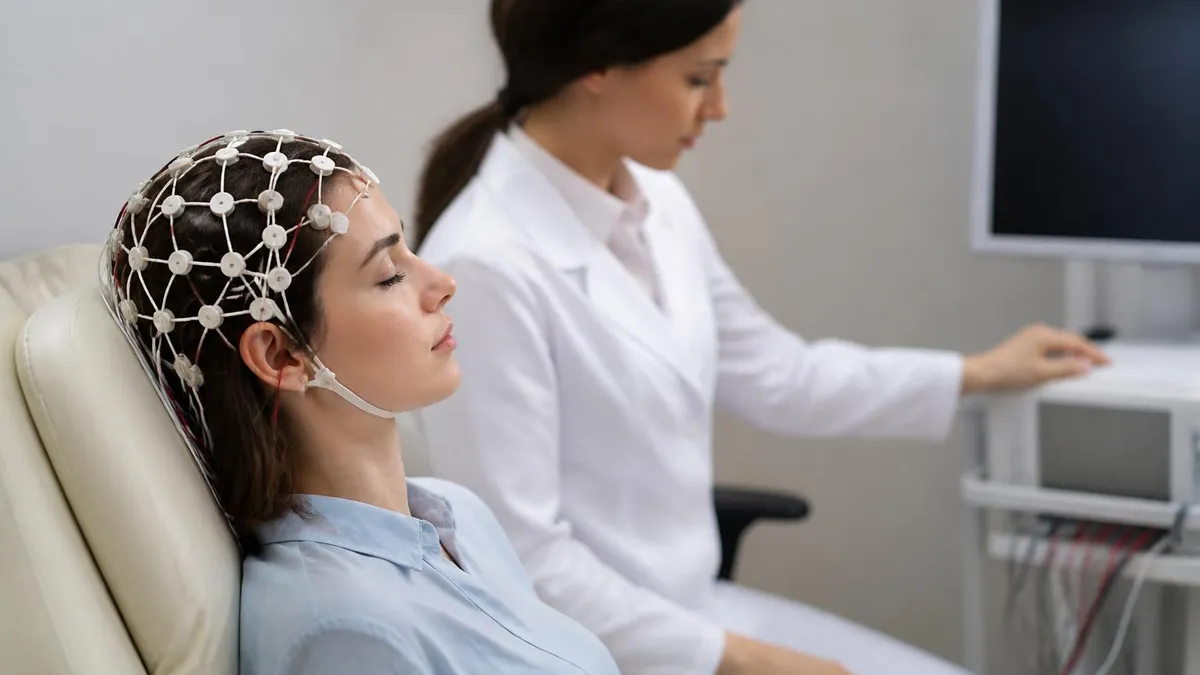
EEG vs ECG vs EKG: What Each Test Measures, How They Differ, and What to Expect

EEG Medical Definition: What Is an EEG Test, How It Works, and What to Expect
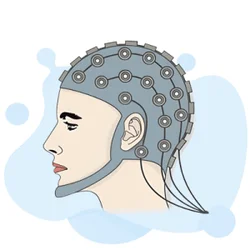
EEG Electroencephalography Practice Test PDF (Free Printable 2026)

Seizure EEG: What the EEG Test Shows, How It Works, and What to Expect
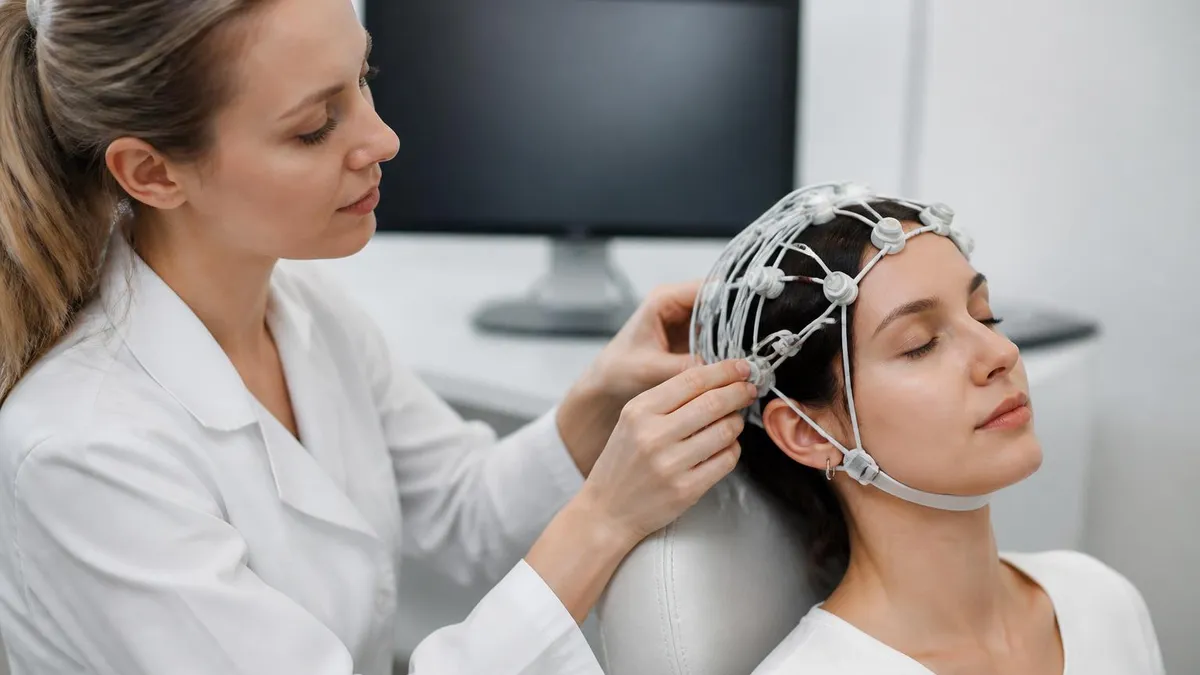
Sleep EEG: How Overnight Brain Wave Testing Works and What Your Results Mean
About the Author

Educational Psychologist & Academic Test Preparation Expert
Columbia University Teachers CollegeDr. Lisa Patel holds a Doctorate in Education from Columbia University Teachers College and has spent 17 years researching standardized test design and academic assessment. She has developed preparation programs for SAT, ACT, GRE, LSAT, UCAT, and numerous professional licensing exams, helping students of all backgrounds achieve their target scores.