EEG Images: A Visual Guide to Brain Wave Patterns, Recordings, and Test Results
EEG test images explained: ❓ see normal and abnormal brain wave patterns, learn what an EEG medical test shows, costs, side effects, and how long it takes.
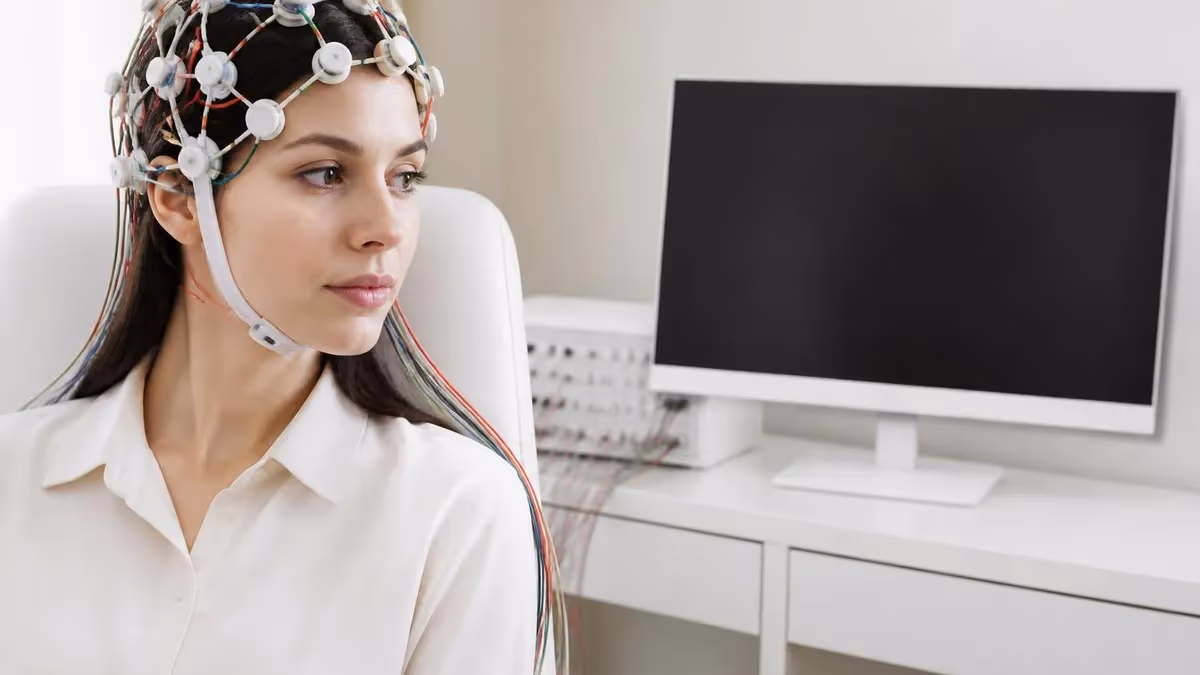
When most people search for eeg images, they are trying to make sense of the squiggly lines they saw on a screen during an eeg test or in a neurologist's office. Those wavy traces are not random scribbles. Each line represents the electrical activity of millions of neurons firing in a specific region of the brain, captured by electrodes placed across the scalp. Learning to recognize these visual patterns is the first step in understanding what your brain is doing during sleep, seizures, focus, and rest.
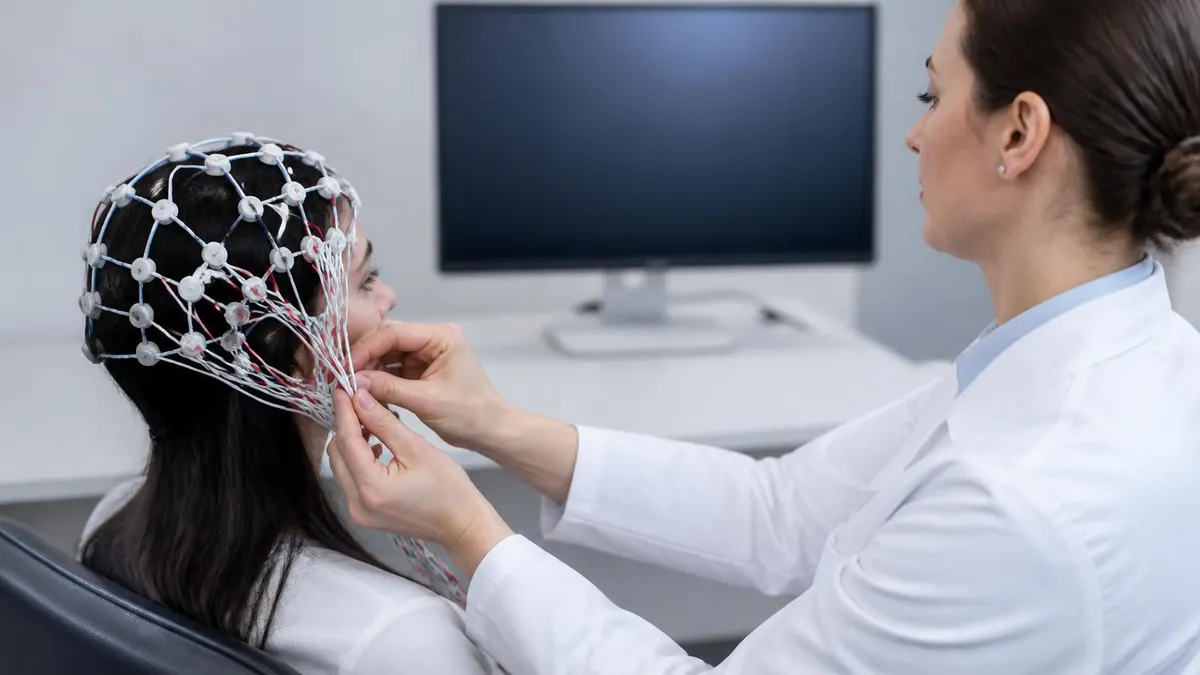
An eeg test, short for electroencephalogram, records voltage changes from the cortex through small metal sensors attached with paste or a stretchy cap. The output is a multi-channel tracing, usually shown in 30-second screens, with each row representing a different electrode pair. When neurologists review eeg images, they look for rhythm, amplitude, frequency, symmetry, and the presence of unusual transients. These five visual qualities tell a story about whether the brain is healthy, drowsy, sleeping, irritated, or in the middle of an epileptic discharge.
The volume of search interest for the eeg test reflects how common the procedure has become. With over 40,000 monthly searches in the United States alone, patients and students alike want clear, accurate pictures of what these recordings look like. Unfortunately, many online resources show only cartoon waves or overly simplified diagrams that do not match the real complexity of clinical tracings. Real eeg images are dense, layered, and full of artifact that must be filtered out by a trained eye.
This guide walks you through the most important categories of eeg images you will encounter, from normal alpha rhythm with eyes closed to spike-and-wave complexes in absence epilepsy, burst-suppression in coma, and the slow polymorphic delta of a structural lesion. We will also cover routine, ambulatory, video, and long-term monitoring setups, because the type of recording strongly shapes how the resulting images look and what they can prove.
If you are scheduled for a test, you may also be wondering what is an eeg test actually like in real time, and how the technologist turns raw electrical noise into a clean readable tracing. We will answer those practical questions throughout, alongside the visual reference material. By the end, you should be able to glance at an eeg image and identify the basic rhythm, the patient state, and at least one or two notable findings if they are present.
Whether you are a curious patient, a nursing student rotating through neurology, a tech preparing for ABRET registry exams, or a caregiver helping a loved one with epilepsy, this article gives you the visual vocabulary to interpret what you see. We will pair every concept with the kind of practical detail you cannot get from a single textbook image, including the typical channel layout, the time and voltage scales, and the artifacts that most often fool first-time readers.
Let us begin with the numbers behind eeg testing in the United States, because understanding scale and cost helps frame why these images matter so much to so many people.
EEG Testing in the US by the Numbers

How an EEG Image Is Created Step by Step
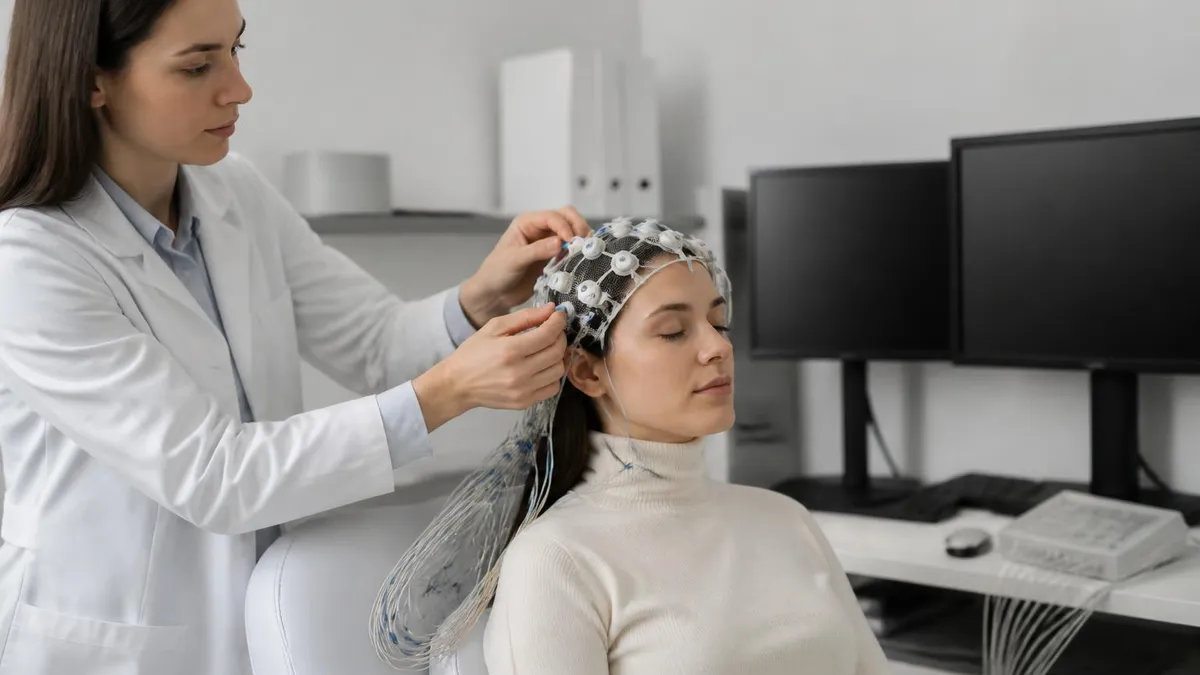
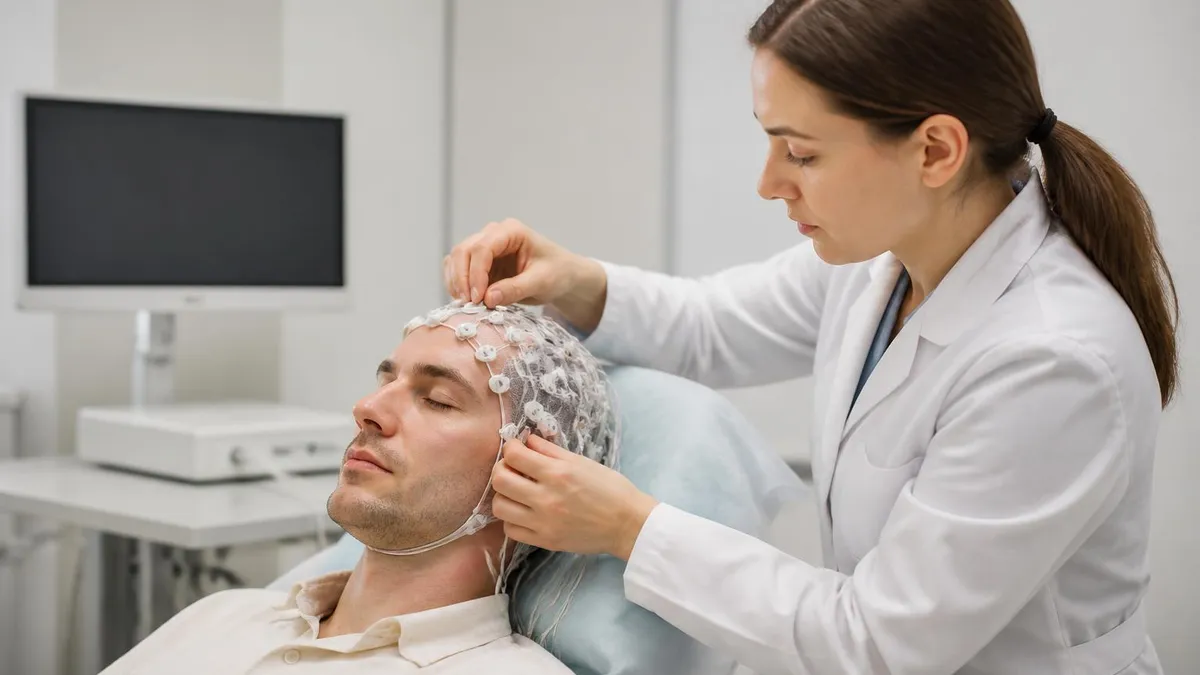
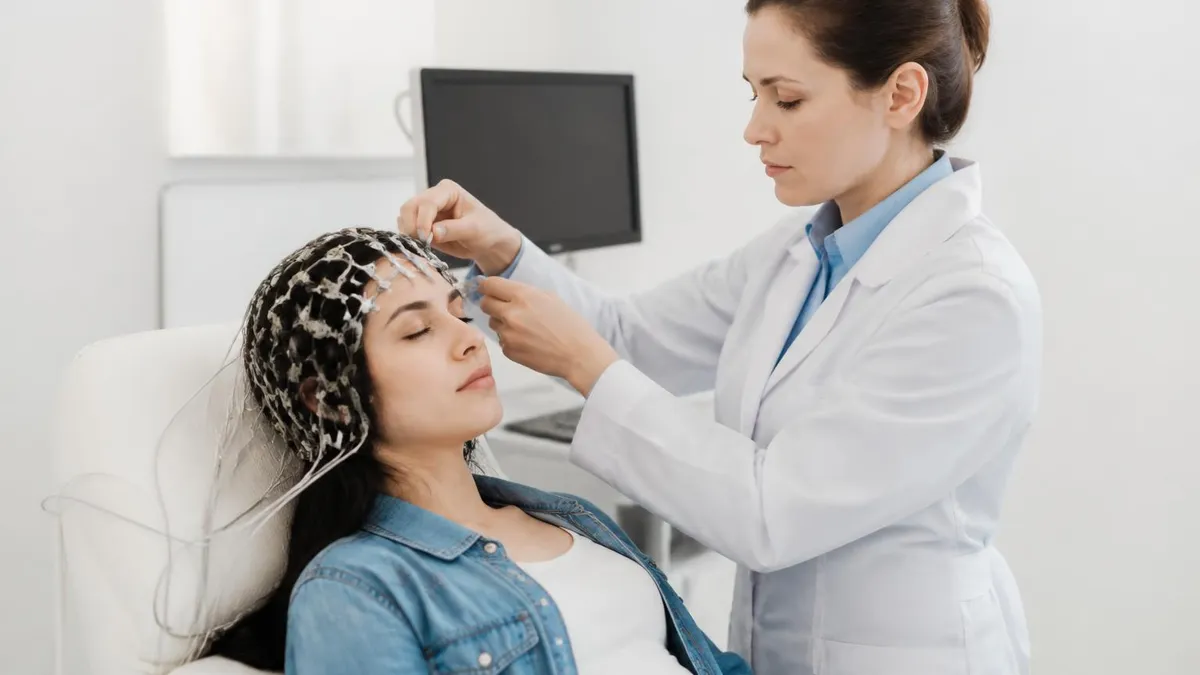
Electrode Placement
Impedance Check
Baseline Recording
Activation Procedures
Montage Review
Normal eeg images have a recognizable signature that varies by age, state of arousal, and the part of the brain being recorded. In a relaxed adult with eyes closed, the dominant feature is the posterior alpha rhythm, an 8 to 13 Hz oscillation that appears strongest over the occipital electrodes O1 and O2. When the patient opens their eyes, this rhythm attenuates dramatically, a phenomenon called alpha blocking. Watching alpha disappear and return on screen is one of the first satisfying patterns a new reader learns to spot.
Beta activity, faster than 13 Hz, is normally present over the frontal regions and increases with medications like benzodiazepines and barbiturates. On an eeg image, beta looks like a fine, low-amplitude buzz layered on top of slower rhythms. It is symmetric, generally less than 20 microvolts, and rarely diagnostically important on its own. However, the absence of expected beta over one hemisphere can signal an underlying structural problem like a subdural fluid collection.
Theta activity, 4 to 7 Hz, is normal in children and during drowsiness in adults. A small amount of frontal and temporal theta in an awake adult is fine, but excessive or focal theta becomes suspicious. Delta activity, under 4 Hz, is the slowest and largest band. It dominates deep sleep tracings and is also a marker of pathology when seen in awake adults, especially when it is focal and polymorphic rather than rhythmic.
Sleep eeg images are visually distinct and clinically rich. Stage N1 shows vertex sharp waves and slow rolling eye movements. Stage N2 introduces sleep spindles, brief 12 to 14 Hz bursts over the central regions, and K-complexes, which look like a sharp downward then upward deflection. Stage N3 is dominated by high-amplitude delta. REM sleep returns the tracing to a low-voltage mixed-frequency pattern with rapid eye movements visible on the eye leads.
Age dramatically changes what counts as normal. Newborn eeg images contain discontinuous tracé alternant and tracé discontinu patterns that would look pathological in an adult. By age three, the posterior dominant rhythm is established near 8 Hz and gradually matures to adult alpha by adolescence. Elderly patients may show mild diffuse slowing without any underlying disease, so context and age-appropriate norms always matter when interpreting an eeg test.
Reading normal variants is just as important as recognizing disease. Patterns like wicket spikes, benign sporadic sleep spikes, 14 and 6 positive spikes, and rhythmic temporal theta of drowsiness can mimic epileptiform discharges to the untrained eye. Misidentifying these variants leads to unnecessary anti-seizure medications and lifelong driving restrictions, which is why what is eeg test training emphasizes pattern discrimination so heavily.
Finally, every normal eeg image must be assessed for symmetry. The two hemispheres should produce mirror-image tracings in amplitude, frequency, and reactivity. Persistent asymmetry greater than 50 percent in amplitude or a clear frequency difference between sides is abnormal and warrants further investigation with imaging studies like MRI or CT.
EEG Practice Test Questions
Prepare for the EEG - Electroencephalography exam with our free practice test modules. Each quiz covers key topics to help you pass on your first try.
EEG Abnormal Epileptiform Patterns
EEG Exam Questions covering Abnormal Epileptiform Patterns. Master EEG Test concepts for certification prep.
EEG Activation Procedures
Free EEG Practice Test featuring Activation Procedures. Improve your EEG Exam score with mock test prep.
EEG Artifact Identification
EEG Test Prep for Artifact Identification. Practice EEG Quiz questions and boost your score.
EEG Electrode Placement and Montages
EEG Questions and Answers on Electrode Placement and Montages. Free EEG practice for exam readiness.
EEG - Electroencephalography Abnormal Epil...
EEG Mock Test covering - Electroencephalography Abnormal Epileptiform Patterns. Online EEG Test practice with instant feedback.
EEG - Electroencephalography Activation Pr...
Free EEG Quiz on - Electroencephalography Activation Procedures. EEG Exam prep questions with detailed explanations.
EEG - Electroencephalography Artifact Iden...
EEG Practice Questions for - Electroencephalography Artifact Identification. Build confidence for your EEG certification exam.
EEG - Electroencephalography Electrode Pla...
EEG Test Online for - Electroencephalography Electrode Placement and Montages. Free practice with instant results and feedback.
EEG - Electroencephalography Instrumentati...
EEG Study Material on - Electroencephalography Instrumentation and Calibration. Prepare effectively with real exam-style questions.
EEG - Electroencephalography Neuroanatomy ...
Free EEG Test covering - Electroencephalography Neuroanatomy and Physiology. Practice and track your EEG exam readiness.
EEG - Electroencephalography Non-Epileptif...
EEG Exam Questions covering - Electroencephalography Non-Epileptiform Abnormalities. Master EEG Test concepts for certification prep.
EEG - Electroencephalography Normal EEG Wa...
Free EEG Practice Test featuring - Electroencephalography Normal EEG Waveforms. Improve your EEG Exam score with mock test prep.
EEG - Electroencephalography Patient Safet...
EEG Mock Exam on - Electroencephalography Patient Safety and Ethics. EEG Study Guide questions to pass on your first try.
EEG - Electroencephalography Pediatric and...
EEG Test Prep for - Electroencephalography Pediatric and Neonatal EEG. Practice EEG Quiz questions and boost your score.
EEG ICU and Continuous EEG Monitoring
EEG Questions and Answers on ICU and Continuous EEG Monitoring. Free EEG practice for exam readiness.
EEG Instrumentation and Calibration
EEG Mock Test covering Instrumentation and Calibration. Online EEG Test practice with instant feedback.
EEG Neuroanatomy and Physiology
Free EEG Quiz on Neuroanatomy and Physiology. EEG Exam prep questions with detailed explanations.
EEG Non-Epileptiform Abnormalities
EEG Practice Questions for Non-Epileptiform Abnormalities. Build confidence for your EEG certification exam.
EEG Normal EEG Waveforms
EEG Test Online for Normal EEG Waveforms. Free practice with instant results and feedback.
EEG Patient Safety and Ethics
EEG Study Material on Patient Safety and Ethics. Prepare effectively with real exam-style questions.
EEG Test Types and What Their Images Look Like
A routine eeg test lasts about 20 to 40 minutes and produces roughly 40 to 80 pages of tracings when reviewed in standard 30-second epochs. The images show wakefulness, drowsiness if it occurs, and the response to hyperventilation and photic stimulation. This is the most common eeg medical test ordered for a first-time seizure evaluation in adults.
Routine images are limited because most seizures occur outside the recording window. Sensitivity for detecting epileptiform discharges in a single routine study is only about 30 to 50 percent. Repeating the study or adding sleep deprivation increases yield. Despite limitations, routine eeg remains the workhorse of outpatient neurology because of its short duration and low cost.
EEG Imaging vs Other Brain Tests: Pros and Cons
- +Direct real-time measurement of brain electrical activity in milliseconds
- +Non-invasive with no radiation exposure during the test
- +Relatively low eeg test cost compared to MRI or PET imaging
- +Highly sensitive for detecting seizure activity and epileptic patterns
- +Portable for ambulatory and bedside ICU monitoring scenarios
- +Safe for children, pregnant patients, and people with metal implants
- +Provides functional information that structural imaging cannot reveal
- −Limited spatial resolution compared to MRI or CT scans of the brain
- −Sensitivity for catching seizures during a 30 minute recording is low
- −Image quality suffers from muscle, eye blink, and movement artifact
- −Requires hair washing and paste removal which patients dislike
- −Interpretation requires specialized training and varies between readers
- −Cannot directly visualize tumors, strokes, or anatomical brain lesions
Reading EEG Images: A Systematic Review Checklist
- ✓Verify patient identifiers, recording date, and technologist notes before starting
- ✓Confirm the montage in use and switch between bipolar and referential views
- ✓Check the time base (typically 30 mm per second) and sensitivity (7 microvolts per mm)
- ✓Identify the dominant posterior background rhythm and its reactivity to eye opening
- ✓Assess symmetry between left and right hemispheres in amplitude and frequency
- ✓Scan for focal slowing, focal attenuation, or focal fast activity in any region
- ✓Look for epileptiform discharges including spikes, sharp waves, and spike-wave complexes
- ✓Evaluate the response to hyperventilation and photic stimulation activation
- ✓Identify state changes from wake to drowsy to sleep and note any abnormalities
- ✓Distinguish artifact from cerebral activity using clinical and electrical clues
- ✓Write a structured report covering background, abnormalities, and clinical correlation
Always identify the background rhythm first
Before searching for any abnormality in an eeg image, lock down the posterior dominant rhythm and confirm its reactivity to eye opening. Roughly 80 percent of meaningful findings only make sense in context of a properly identified background. Skipping this step is the single most common mistake new readers make and leads to both false positives and missed real abnormalities.
Abnormal eeg images fall into two broad categories: epileptiform abnormalities, which suggest a tendency toward seizures, and non-epileptiform abnormalities, which point to other types of brain dysfunction. Recognizing the difference visually is the central skill of clinical electroencephalography. Both categories are further divided into focal patterns, limited to one region, and generalized patterns, which appear across both hemispheres simultaneously. The shape, distribution, and timing of waveforms together determine which category a finding belongs to.
Spikes are the classic epileptiform discharge. On an eeg image, a spike is a sharply pointed waveform lasting less than 70 milliseconds, usually followed by a slow aftercoming wave. Sharp waves are similar but last 70 to 200 milliseconds. Both stand out from the background because they look pointed, like an isolated mountain peak interrupting a row of gentle hills. They are most often seen in focal epilepsies and their location helps identify the seizure focus.
Spike-and-wave complexes are pairs of a spike followed by a slow wave. The classic 3 Hz generalized spike-and-wave pattern is the hallmark of childhood absence epilepsy and looks remarkably uniform across all electrodes simultaneously. Polyspike-and-wave, with multiple spikes preceding the slow wave, suggests juvenile myoclonic epilepsy. These patterns are so visually distinctive that experienced readers identify them in seconds.
Focal slowing is a non-epileptiform abnormality where one region of the brain produces unusually slow waves in the theta or delta range. Polymorphic delta over one temporal lobe, for example, often correlates with an underlying structural lesion like a stroke, tumor, or post-traumatic gliosis. Unlike epileptiform patterns, focal slowing usually means a problem with the brain tissue itself rather than a tendency to seize.
Generalized slowing of the entire background can indicate a wide range of conditions including encephalopathy from metabolic derangements, medication effects, infection, or post-ictal states. Triphasic waves, broad three-phase complexes occurring at 1 to 2 Hz, classically appear in hepatic and uremic encephalopathy. Their distinctive shape on an eeg image lets readers strongly suspect a metabolic cause even before lab results return.
Periodic patterns are repetitive complexes occurring at fixed intervals. Periodic lateralized epileptiform discharges, called PLEDs or LPDs in current nomenclature, suggest acute focal brain injury, often from stroke or herpes encephalitis. Burst suppression is an alternating pattern of high-voltage bursts and flat suppression seen in deep anesthesia, severe hypoxic injury, and barbiturate coma. These severe patterns immediately change clinical management.
The most dramatic abnormal pattern is the actual seizure recording, called an ictal eeg. The image evolves over seconds, typically starting with a build-up of rhythmic activity that grows in amplitude and slows in frequency before terminating abruptly into a post-ictal suppression. Capturing a seizure on eeg is the definitive diagnostic moment that justifies long-term monitoring in patients with uncertain spell types.

Identifying abnormal patterns is not a skill that can be self-taught from sample images alone. Misreading benign variants as epileptiform discharges leads to incorrect epilepsy diagnoses, unnecessary medication, and avoidable driving restrictions. If you are reviewing your own eeg report, always confirm interpretations with a board-certified neurologist or epileptologist before drawing conclusions about your health.
EEG test price in the United States varies widely based on the type of recording, the facility, and insurance coverage. A routine outpatient eeg performed at a hospital typically lists between 800 and 3,000 dollars, though contracted insurance rates bring the actual cost much lower. A standalone neurology clinic often charges 300 to 800 dollars cash price for the same study. For an accurate breakdown, the article on eeg medical test pricing covers facility versus professional fees in depth.
EEG test cost rises substantially for longer recordings. Ambulatory 24 to 72 hour studies typically range from 1,500 to 5,000 dollars depending on duration. Inpatient video-eeg monitoring in an epilepsy monitoring unit costs 10,000 to 40,000 dollars or more for a five to seven day admission, though most of that figure represents the inpatient bed and not the eeg itself. Insurance generally covers medically necessary studies when properly authorized.
EEG test side effects are minimal, which is one reason the test has been performed for nearly a century. There is no radiation, no needles in most cases, and no medications required. The most common complaint after a routine study is mild scalp irritation from the paste used to attach electrodes, which usually resolves within a day. Some patients report a mild headache from the strobe light used in photic stimulation.
Hyperventilation can cause temporary lightheadedness, tingling around the mouth, and rarely a brief loss of consciousness in patients with absence epilepsy. Photic stimulation can trigger seizures in patients with photosensitive epilepsy, which is precisely why both activation procedures are performed under direct observation. The technologist is trained to stop activation immediately if a clinical seizure begins.
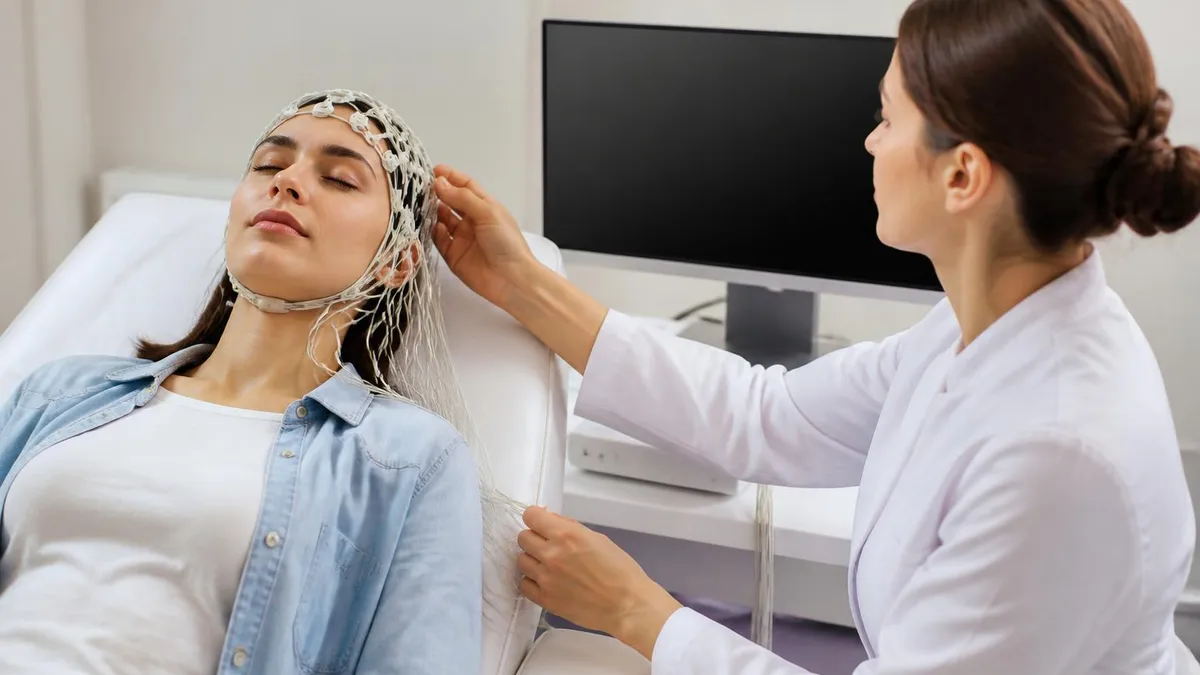
How long is an eeg test? A standard routine recording lasts 20 to 40 minutes of actual recording time, with another 20 to 30 minutes added for electrode application and removal. Total appointment length is usually 60 to 90 minutes. Sleep-deprived studies add a pre-test instruction to stay awake the night before and may include an attempt to capture natural sleep, extending the appointment to two hours.
Preparation for the test is simple. Wash your hair the night before and do not apply conditioner, gel, oil, or hairspray, because these substances interfere with electrode contact and degrade the resulting eeg images. Eat normally unless the ordering physician specifies otherwise. Bring a list of all medications because some, including benzodiazepines and stimulants, affect the recording in predictable ways the reader needs to know.
After the test, the technologist removes the electrodes with warm water and acetone, then provides paper towels for any remaining paste. You can return immediately to normal activities including driving, work, and exercise. Results are typically read by a neurologist within one to seven business days and either sent through a patient portal or discussed at a follow-up visit.
To get the most out of your eeg test, communicate openly with the technologist and the ordering physician before and during the study. If you have had spells, describe them in detail and note when the last one occurred. Bring a list of medications and the times you took them. If you have not slept well, mention it, because sleep deprivation increases the yield for epileptiform discharges and the reader should know whether observed slowing reflects pathology or simple tiredness.
For families of children undergoing eeg testing, the most useful preparation is honest practical conversation. Explain that paste will be put in their hair, that they will need to lie still, and that the room will be dim. Many pediatric labs use distraction techniques like tablets and books. Telling a child the truth about the strobe light beforehand prevents the surprise that often causes mid-test resistance and unusable recordings.
If you are a student learning to read eeg images, build pattern recognition through volume rather than memorization. The ACNS atlas, the Niedermeyer textbook, and online sample libraries each contain hundreds of representative tracings. Set a goal of reviewing five to ten new examples a day, always reading them in a systematic order: background, symmetry, focal abnormalities, epileptiform discharges, state changes, and artifact. Consistency builds the visual database that experienced readers rely on.
Use reference patterns side by side. Compare a real spike to a wicket spike, polymorphic delta to rhythmic temporal theta of drowsiness, and a true triphasic wave to a sharp wave with an aftercoming slow component. Side by side comparison forces the eye to notice the subtle differences in slope, polarity, and field that textbook descriptions cannot convey through words alone.
For ABRET and registered eeg technologist board candidates, practice questions paired with real eeg images are the most efficient study tool. Reviewing isolated facts about the 10-20 system or anti-seizure medications without seeing the corresponding tracings produces shallow learning that fails on exam day. Spaced repetition combined with regular image review is the best preparation method.
If you are a patient seeking a second opinion on your eeg report, request the actual digital eeg file along with the written report. Modern reporting software lets you or another neurologist re-review the raw data using fresh eyes. Interpretation variability is real, especially for borderline findings like rare sharp transients during drowsiness, and a second review by an experienced epileptologist can change diagnoses and management.
Finally, remember that the eeg image is one piece of clinical information, never the whole picture. A normal eeg does not rule out epilepsy, and an abnormal eeg does not always mean disease. The reading must always be correlated with the clinical history, neurological exam, imaging studies, and the patient's lived experience. The wavy lines on the screen are powerful, but they speak most clearly when interpreted in full clinical context.
EEG Questions and Answers
EEG for Seizures: How the Test Diagnoses Epilepsy and What to Expect
EEG Tech Salary 2026: Pay by State, Experience, and Certification
EEG Tech Jobs in 2026: Career Paths, Salaries, and How to Get Hired
Reading EEG Patterns: A Practical Reference for Techs and Trainees
EEG Waves Explained: Delta, Theta, Alpha, Beta, and Gamma Brain Rhythms
About the Author
Educational Psychologist & Academic Test Preparation Expert
Columbia University Teachers CollegeDr. Lisa Patel holds a Doctorate in Education from Columbia University Teachers College and has spent 17 years researching standardized test design and academic assessment. She has developed preparation programs for SAT, ACT, GRE, LSAT, UCAT, and numerous professional licensing exams, helping students of all backgrounds achieve their target scores.