EEG Waves Explained: Delta, Theta, Alpha, Beta, and Gamma Brain Rhythms
EEG test waves explained — frequency, amplitude, location, and meaning of delta, theta, alpha, beta, and gamma rhythms with clinical examples. ✏️
Electroencephalography waves are the rhythmic voltage fluctuations recorded from the scalp during an eeg test, and they remain the single most important visual feature a technologist or neurologist interprets at the bedside. These waves are classified by frequency band — delta, theta, alpha, beta, and gamma — and each band carries distinct clinical meaning depending on the patient's age, state of arousal, and the brain region producing the rhythm. Reading them accurately is the foundation of every clinical EEG report written in the United States today.
The standard 10-20 electrode array captures summated postsynaptic potentials from pyramidal cortical neurons, and the resulting waveforms reflect both local cortical activity and large-scale thalamocortical loops. A 20- to 40-minute routine EEG typically samples wakefulness, drowsiness, light sleep, and the response to activation procedures like hyperventilation and photic stimulation. The waveforms shift predictably across these states, which is why technologists annotate behavioral changes in real time and why interpretation requires understanding normal background variation before flagging anything abnormal.
Frequency bands have widely accepted boundaries: delta sits below 4 Hz, theta spans 4 to under 8 Hz, alpha covers 8 to 13 Hz, beta runs from 13 to 30 Hz, and gamma extends above 30 Hz. Amplitude, symmetry, reactivity, and topographic distribution matter as much as frequency itself. A 10 Hz rhythm over the occipital region that attenuates with eye opening is a healthy posterior dominant rhythm, while the same 10 Hz over the frontal lobes in a drowsy adult would be highly atypical and warrant a closer look.
Patients ask three questions before nearly every recording: what does the procedure feel like, how long does it take, and what will the waves reveal about my brain. The honest answer is that a routine EEG is painless, takes about an hour from electrode application to removal, and produces a frequency map that helps neurologists distinguish epilepsy, encephalopathy, focal cerebral dysfunction, and normal variants. Sleep deprivation, medication state, and prior caffeine intake all change the wave picture, so preparation instructions matter.
This guide walks through each frequency band in clinical detail, then connects the wave patterns to the diagnoses they support, the activation maneuvers that bring them out, and the artifacts that mimic them. We cover age-related changes from neonatal tracings through geriatric EEGs, the difference between a routine study and an extended monitoring session, and the practical workflow technologists follow when an unusual pattern appears mid-recording. Expect concrete numbers, real examples, and reasoning you can apply at the bedside.
Finally, we address the cost, side effect, and access questions that drive patient anxiety before testing. EEGs in the United States range from roughly $200 for a routine outpatient study at a community hospital to several thousand dollars for inpatient long-term video monitoring. Side effects are essentially nonexistent for standard recordings — the test does not deliver any current — though hyperventilation and photic stimulation can briefly provoke symptoms in susceptible patients. With that frame in place, let's look at the waves themselves.
EEG Waves by the Numbers

The Five EEG Frequency Bands
High-amplitude slow waves dominant in deep stage 3 sleep and in infants under one year. Pathologic when present focally or generalized in awake adults — suggests encephalopathy, structural lesion, or post-ictal state.
Drowsiness and light sleep rhythm in adults, but a major background frequency in children. Focal theta in awake adults often points to localized cerebral dysfunction such as stroke, tumor, or focal cortical injury.
The hallmark posterior dominant rhythm of relaxed wakefulness with eyes closed. Attenuates symmetrically with eye opening or mental effort. Asymmetry greater than 50 percent or frequency under 8 Hz in an adult is abnormal.
Low-amplitude fast activity prominent frontally, enhanced by benzodiazepines and barbiturates. Excessive diffuse beta strongly suggests medication effect, while focal loss of beta can indicate a cortical lesion underneath that region.
High-frequency activity tied to active cognitive processing and sensory binding. Rarely measured on standard scalp EEG due to muscle artifact contamination, but increasingly studied in research and intracranial recordings.
Alpha rhythm is the wave clinicians look for first when scoring an awake adult tracing, and understanding its rules answers most of the questions in any introductory what is eeg test tutorial. The classic alpha rhythm appears posteriorly, dominates the occipital and parietal channels, runs between 8 and 13 Hz in healthy adults, and reliably attenuates within one to two seconds of eye opening. This reactivity — called alpha blocking or alpha desynchronization — is the single most reproducible finding in clinical EEG and confirms that the patient is awake and visually attentive.
Alpha frequency matures with age in a predictable curve. At age one the posterior rhythm sits near 5 Hz, climbs to 6 to 7 Hz by age three, reaches 8 Hz around age six, and stabilizes at 9 to 10 Hz by adolescence. In elderly adults a frequency slightly below 9 Hz is acceptable, but anything under 8 Hz in someone over 8 years old is considered slow and raises concern for diffuse cerebral dysfunction. Amplitude typically falls between 30 and 60 microvolts, higher in children, often lower in older adults.
A 10 percent frequency asymmetry between the two hemispheres is normal, but persistent slowing on one side by more than 1 Hz or amplitude reduction beyond 50 percent suggests an ipsilateral cortical problem. This is the Bancaud phenomenon when seen in lesional epilepsy and a useful localizing sign for technologists. Always document head position, eye state, and patient alertness during alpha evaluation — a drowsy patient drops their alpha frequency and amplitude even without any pathology, which is why behavioral annotation is mandatory in every recording.
Mu rhythm is alpha's central cousin. It appears over the sensorimotor cortex at 8 to 13 Hz, has an arch-like or comb-like morphology, and attenuates with movement or even the thought of movement on the contralateral side. Mu can be unilateral, bilateral, or asynchronous, and it is a normal variant — though novice readers occasionally mistake it for a focal abnormality because it persists when occipital alpha is blocked by eye opening. Recognizing mu prevents over-calling normal findings as suspicious.
Beyond alpha and mu, several normal alpha-range variants deserve mention. Lambda waves are sharp positive transients at the occipital electrodes triggered by visual scanning. The temporal alpha of the elderly, often seen during light drowsiness in patients over 60, is benign. Frontal alpha can emerge briefly during the transition into drowsiness in some patients. Each of these patterns has a specific behavioral correlate, and recognizing them prevents inappropriate clinical alarm and unnecessary follow-up testing.
Alpha coma is a critical exception to all the rules above. After severe anoxic injury, post-cardiac-arrest patients can show a diffuse, non-reactive alpha-frequency pattern that does not attenuate with stimulation. Despite the frequency, this pattern carries a grim prognosis and is fundamentally different from normal alpha. The distinguishing features are diffuse distribution rather than posterior dominance, lack of reactivity, and the clinical context of coma. Misreading alpha coma as a normal awake rhythm is one of the most consequential errors in critical care EEG interpretation.
Beta activity sits anatomically frontal and electrically faster, usually under 20 microvolts and from 13 to 30 Hz. A modest amount of frontal beta is normal in nearly everyone, but diffuse beta exceeding 25 microvolts almost always signals benzodiazepine, barbiturate, or chloral hydrate exposure. Asking the patient about anxiolytics, sleep aids, or pre-procedure sedation is a routine part of the technologist's history and saves the reader from chasing a phantom pharmacologic finding through the rest of the tracing.

EEG Practice Test Questions
Prepare for the EEG - Electroencephalography exam with our free practice test modules. Each quiz covers key topics to help you pass on your first try.
EEG Abnormal Epileptiform Patterns
EEG Exam Questions covering Abnormal Epileptiform Patterns. Master EEG Test concepts for certification prep.
EEG Activation Procedures
Free EEG Practice Test featuring Activation Procedures. Improve your EEG Exam score with mock test prep.
EEG Artifact Identification
EEG Test Prep for Artifact Identification. Practice EEG Quiz questions and boost your score.
EEG Electrode Placement and Montages
EEG Questions and Answers on Electrode Placement and Montages. Free EEG practice for exam readiness.
EEG - Electroencephalography Abnormal Epil...
EEG Mock Test covering - Electroencephalography Abnormal Epileptiform Patterns. Online EEG Test practice with instant feedback.
EEG - Electroencephalography Activation Pr...
Free EEG Quiz on - Electroencephalography Activation Procedures. EEG Exam prep questions with detailed explanations.
EEG - Electroencephalography Artifact Iden...
EEG Practice Questions for - Electroencephalography Artifact Identification. Build confidence for your EEG certification exam.
EEG - Electroencephalography Electrode Pla...
EEG Test Online for - Electroencephalography Electrode Placement and Montages. Free practice with instant results and feedback.
EEG - Electroencephalography Instrumentati...
EEG Study Material on - Electroencephalography Instrumentation and Calibration. Prepare effectively with real exam-style questions.
EEG - Electroencephalography Neuroanatomy ...
Free EEG Test covering - Electroencephalography Neuroanatomy and Physiology. Practice and track your EEG exam readiness.
EEG - Electroencephalography Non-Epileptif...
EEG Exam Questions covering - Electroencephalography Non-Epileptiform Abnormalities. Master EEG Test concepts for certification prep.
EEG - Electroencephalography Normal EEG Wa...
Free EEG Practice Test featuring - Electroencephalography Normal EEG Waveforms. Improve your EEG Exam score with mock test prep.
EEG - Electroencephalography Patient Safet...
EEG Mock Exam on - Electroencephalography Patient Safety and Ethics. EEG Study Guide questions to pass on your first try.
EEG - Electroencephalography Pediatric and...
EEG Test Prep for - Electroencephalography Pediatric and Neonatal EEG. Practice EEG Quiz questions and boost your score.
EEG ICU and Continuous EEG Monitoring
EEG Questions and Answers on ICU and Continuous EEG Monitoring. Free EEG practice for exam readiness.
EEG Instrumentation and Calibration
EEG Mock Test covering Instrumentation and Calibration. Online EEG Test practice with instant feedback.
EEG Neuroanatomy and Physiology
Free EEG Quiz on Neuroanatomy and Physiology. EEG Exam prep questions with detailed explanations.
EEG Non-Epileptiform Abnormalities
EEG Practice Questions for Non-Epileptiform Abnormalities. Build confidence for your EEG certification exam.
EEG Normal EEG Waveforms
EEG Test Online for Normal EEG Waveforms. Free practice with instant results and feedback.
EEG Patient Safety and Ethics
EEG Study Material on Patient Safety and Ethics. Prepare effectively with real exam-style questions.
How Long Is an EEG Test and What Does It Cost
A routine outpatient EEG takes roughly one hour from arrival to discharge. Electrode application using collodion or paste consumes 15 to 25 minutes, the actual recording runs 20 to 40 minutes including hyperventilation and photic stimulation, and electrode removal with acetone or warm water adds another 10 minutes. Most US labs schedule a 90-minute appointment to allow for paperwork and any unexpected technical adjustments during setup.
Extended studies look very different. A sleep-deprived EEG runs 60 to 90 minutes of recording, an ambulatory EEG continues for 24 to 72 hours at home, and inpatient video-EEG monitoring can last three to seven days. The longer the recording, the higher the yield for capturing intermittent events like seizures or sleep-related discharges that a brief routine study will miss entirely.
Routine EEG vs Extended Monitoring: Which Captures More?
- +Routine EEG is widely available and can be scheduled within a week at most US neurology clinics
- +Cost of routine study is one-tenth to one-thirtieth that of inpatient long-term monitoring
- +Activation procedures during routine EEG provoke abnormalities in many epilepsy patients
- +No hospitalization required and the patient returns to normal activity immediately
- +Sleep deprivation before a routine study substantially raises the yield for epileptiform findings
- +Routine recordings are sufficient to diagnose most generalized epilepsies and many focal syndromes
- +Insurance authorization is straightforward and rarely requires advanced documentation
- −A 20-minute window misses intermittent discharges that occur only a few times per day
- −Single recordings have only 30 to 50 percent sensitivity for interictal epileptiform abnormalities
- −Cannot capture actual seizure semiology without simultaneous video
- −Sleep architecture sampling is limited to drowsiness and light stage 2 sleep at most
- −Medication effects during the recording window may obscure underlying patterns
- −Provocation testing has contraindications including recent stroke and significant cardiopulmonary disease
- −Negative routine EEG does not rule out epilepsy and may delay appropriate diagnosis

EEG Medical Test Preparation Checklist
- ✓Wash hair the night before with regular shampoo and skip all conditioner, oil, gel, mousse, and hairspray
- ✓Eat a normal meal before the appointment to avoid hypoglycemia-induced slowing on the tracing
- ✓Take all routinely prescribed medications unless your ordering physician specifically instructs otherwise
- ✓Skip coffee, tea, energy drinks, and chocolate for at least four hours before the recording
- ✓If sleep deprivation is requested, sleep no more than four hours the night before the study
- ✓Bring a list of every prescription medication, supplement, and over-the-counter drug taken in the past week
- ✓Arrange transportation home if your study includes sleep deprivation or you commonly drive drowsy
- ✓Wear a button-down or zip-front shirt so you do not pull off electrodes when changing afterward
- ✓Plan to wash your hair again after the study to remove residual collodion or electrode paste
- ✓Inform the technologist if you have any open scalp wounds, hair extensions, or recent surgery on the head
Sleep deprivation roughly doubles epileptiform yield
A sleep-deprived EEG captures interictal epileptiform discharges in approximately 30 to 35 percent of epilepsy patients whose routine awake-only study was unremarkable. The mechanism is partly direct neuronal hyperexcitability from sleep loss and partly the capture of stage 1 and stage 2 sleep, the states during which most focal and generalized discharges emerge most readily.
Abnormal wave patterns fall into two broad categories: slowing and epileptiform activity. Slowing means lower-than-expected frequency for the patient's age and arousal state — most often in the theta or delta range. Focal slowing localizes to underlying cortical dysfunction such as stroke, tumor, abscess, or post-traumatic encephalomalacia. Generalized slowing reflects diffuse processes including metabolic encephalopathy, anoxic injury, encephalitis, and severe medication effect. The distribution and reactivity of the slow waves matter as much as the slowing itself.
Polymorphic delta activity that is continuous, irregular, and non-reactive carries a worse prognosis than intermittent rhythmic delta, which can appear in mild encephalopathy or even in deep stage 3 sleep. Frontal intermittent rhythmic delta activity, abbreviated FIRDA, was historically associated with deep midline lesions but is now recognized as a fairly nonspecific marker of encephalopathy in adults. Occipital intermittent rhythmic delta, OIRDA, by contrast, has a strong association with childhood absence epilepsy and warrants specific clinical correlation.
Epileptiform discharges include spikes, sharp waves, polyspikes, and spike-and-wave complexes. A spike is a transient under 70 milliseconds in duration with a clear electrical field that disrupts background activity. A sharp wave is similar but lasts 70 to 200 milliseconds. Both must stand out from background, have a logical electrical field across adjacent electrodes, and ideally show an after-going slow wave to be confidently called epileptiform rather than dismissed as artifact or normal variant.
Generalized 3 Hz spike-and-wave complexes are the signature of childhood absence epilepsy and typically provoke a brief staring spell during the discharge. Generalized polyspike-and-wave is more characteristic of juvenile myoclonic epilepsy. Hypsarrhythmia — a chaotic, high-amplitude, multifocal pattern in infants — defines the EEG of infantile spasms and demands urgent treatment. Periodic lateralized epileptiform discharges, called PLEDs or LPDs in current nomenclature, suggest acute focal cortical injury, often from herpes encephalitis, stroke, or rapidly growing tumors.
Burst-suppression is a pattern of high-amplitude bursts alternating with relatively flat suppression periods. In the operating room under deep anesthesia it is a target endpoint, but in a patient not under anesthesia it indicates severe diffuse cerebral dysfunction with a poor prognosis. Electrocerebral inactivity, the formal definition of which requires no activity above 2 microvolts across a full technical protocol, supports brain death determination when accompanied by all required clinical examination and ancillary findings.
Normal variants masquerade as pathology more often than novices expect. Wicket spikes, small sharp spikes, 14 and 6 positive bursts, rhythmic midtemporal theta of drowsiness, and subclinical rhythmic electrographic discharges of adults all share features with epileptiform activity but have specific morphologies and behavioral states that identify them as benign. Misreading a wicket spike as a temporal lobe spike has launched many patients onto unnecessary antiseizure medication, so pattern recognition matters enormously to patient outcomes.
Photic stimulation must be stopped immediately if a photoparoxysmal response generalizes or persists beyond the flash train, and any patient with a known history of photosensitive epilepsy should have the procedure performed with seizure precautions in place. The technologist controls the strobe at all times and never delegates this step to the patient.
For technologists, the difference between an adequate recording and an excellent one comes down to attention to artifact, behavioral state, and electrode integrity. Every recording starts with impedance checks below 5 kilohms, a calibration that confirms equal gain across channels, and a careful look at the raw signal before recording proper begins. Reading classic what is an eeg test background patterns becomes second nature only after consistent practice on hundreds of normal studies, which is why training programs emphasize normal-variant recognition first.
Artifact recognition saves more interpretation errors than any other skill. Eye blinks produce frontopolar downward deflections, lateral eye movements show opposite polarity at F7 and F8, EKG artifact appears as rhythmic sharp transients tied to the QRS, and muscle artifact contaminates temporal and frontal channels with brief high-frequency spikes. Glossokinetic artifact from tongue movement, sweat artifact from autonomic activity, and 60 Hz line noise all have distinctive signatures the technologist learns to identify and document.
Behavioral annotation is mandatory throughout the recording. Note eye opening and closing, hyperventilation start and stop, photic stimulation frequencies, any reported symptom, any movement, and any time the patient speaks. These annotations let the reader correlate clinical events with the electrical record and distinguish a true ictal pattern from a movement artifact. A recording without behavioral notes is dramatically harder to interpret and may be considered technically inadequate.
Montage selection changes what the reader sees. Bipolar longitudinal — the so-called double banana — emphasizes phase reversals and helps localize focal abnormalities. Average reference shows amplitude topography clearly. Laplacian montages enhance local activity by canceling distant signals. Most reading neurologists toggle between two or three montages on any single tracing, and modern digital systems make these switches trivial during review.
Pediatric EEG demands its own reference points. Neonates show discontinuous tracé alternant or tracé discontinu patterns that would be alarming at any other age. Sleep spindles appear by three months, K-complexes by six months, and a mature posterior dominant rhythm not until age 8 to 10. Hypnagogic hypersynchrony — bursts of high-amplitude rhythmic theta during drowsiness — is a normal childhood finding that older readers occasionally misread as abnormal slowing.
Geriatric tracings show their own predictable changes. Posterior dominant rhythm slows by roughly 0.5 to 1 Hz between ages 60 and 90 but should remain above 8 Hz. Temporal slowing of the elderly, particularly over the left side, is common and benign when intermittent, low in amplitude, and not accompanied by sharp morphology. Recognizing these aging features prevents over-calling normal senescence as encephalopathy in cognitively healthy older adults.
Finally, communication with the ordering physician closes the loop. A clear technical narrative — including hours slept, medications taken, sedation status, and any clinical events — gives the reading neurologist everything needed to write an actionable report. Technologists who write strong technical reports get faster, more accurate clinical interpretations, and patients get better care as a direct result.
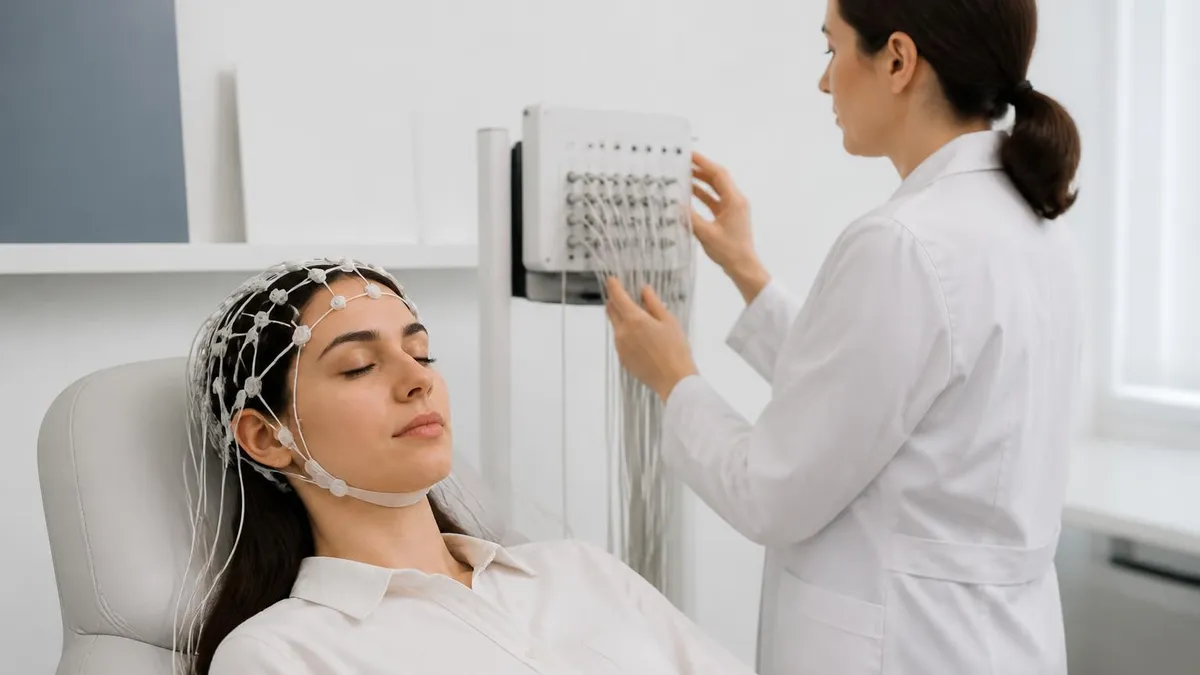
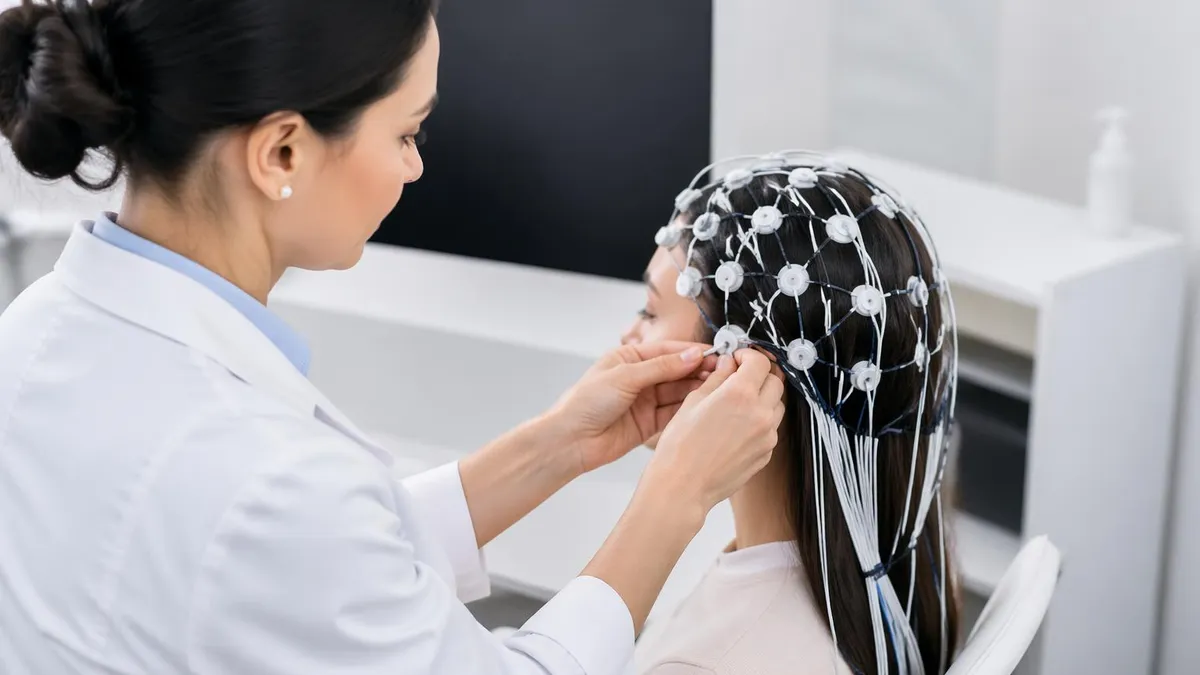
For patients preparing for an EEG, the most useful mental model is this: the test reads brain electricity but does not write any current back. No shocks, no needles into the scalp, no radiation, no contrast. Electrodes are small metal discs glued or pasted onto cleaned skin in 19 standard positions, plus a few reference electrodes. The whole experience should feel like getting your hair fussed with for a while and then lying quietly with your eyes closed. Anxiety beforehand is normal, but the procedure itself is one of the gentler diagnostic tests in modern neurology.
During the recording, expect to be asked to open and close your eyes on command several times, breathe deeply and rapidly for three minutes during hyperventilation, and watch a flashing strobe at different frequencies during photic stimulation. You will likely be encouraged to drift into a brief sleep, especially if you came in sleep-deprived. The room is quiet, the lights are low, and the technologist is in the room or just outside the entire time. Speak up if you feel uncomfortable, dizzy, or in need of a pause.
Afterward, the technologist removes electrodes with acetone or warm water and you will have a small amount of residue in your hair. A second shampoo at home with dish soap or a clarifying shampoo usually clears the rest. You can drive yourself home unless you underwent significant sleep deprivation, in which case arrange a ride. There are no activity restrictions, and you can return immediately to work, exercise, or normal routines without any recovery period.
Results typically reach the ordering physician within three to seven business days. The report describes background activity, response to activation procedures, presence or absence of epileptiform activity, and any focal or generalized abnormalities, then concludes with a clinical impression. Patients sometimes get partial results immediately if a clearly diagnostic pattern was recorded, but most readings require careful review and signed final interpretation by a board-certified neurophysiologist before any treatment decisions follow.
If your EEG is normal but your clinical history strongly suggests seizures, do not be discouraged. A single 20-minute recording captures only a tiny window of brain activity, and roughly half of patients with confirmed epilepsy have a normal first EEG. Repeat recordings, sleep-deprived studies, ambulatory monitoring, or inpatient video-EEG can substantially raise sensitivity. The strategy your neurologist chooses depends on event frequency, the type of seizures suspected, and how the diagnosis will change management.
If your EEG is abnormal, the meaning depends entirely on the pattern, the clinical context, and your overall neurologic exam. Slowing in the setting of new confusion has a very different significance than a single spike during drowsiness in someone with a known seizure disorder. Bring specific questions to your follow-up: what is the pattern called, what does it suggest, what changes in treatment does it prompt, and does it require any additional testing such as MRI or repeat EEG.
Above all, treat the EEG as one piece of evidence in a larger clinical picture. Seizures are diagnosed clinically; EEG supports the diagnosis and helps classify it. Encephalopathy is suspected clinically; EEG confirms and grades its severity. The waveforms are remarkable tools, but their meaning emerges only when paired with a good history, a careful examination, and thoughtful judgment about what to do next. That partnership between bedside and tracing is what makes electroencephalography the durable bedside neuroscience tool it has been for nearly a century.
EEG Questions and Answers
EEG Tech Salary 2026: Pay by State, Experience, and Certification
EEG Tech Jobs in 2026: Career Paths, Salaries, and How to Get Hired
Reading EEG Patterns: A Practical Reference for Techs and Trainees
Ambulatory EEG: 24-72 Hour Home Recording for Suspected Seizures
What Is an EEG? Electroencephalography Complete Guide 2026
About the Author
Educational Psychologist & Academic Test Preparation Expert
Columbia University Teachers CollegeDr. Lisa Patel holds a Doctorate in Education from Columbia University Teachers College and has spent 17 years researching standardized test design and academic assessment. She has developed preparation programs for SAT, ACT, GRE, LSAT, UCAT, and numerous professional licensing exams, helping students of all backgrounds achieve their target scores.