
T1 and T2 MRI — Complete Guide (2026 September)
🎓 T1 vs T2 MRI explained: relaxation times, tissue contrast, STIR, FLAIR, fat-vs-water mnemonics, and a clinical reading guide for brain, spine, and lesions.
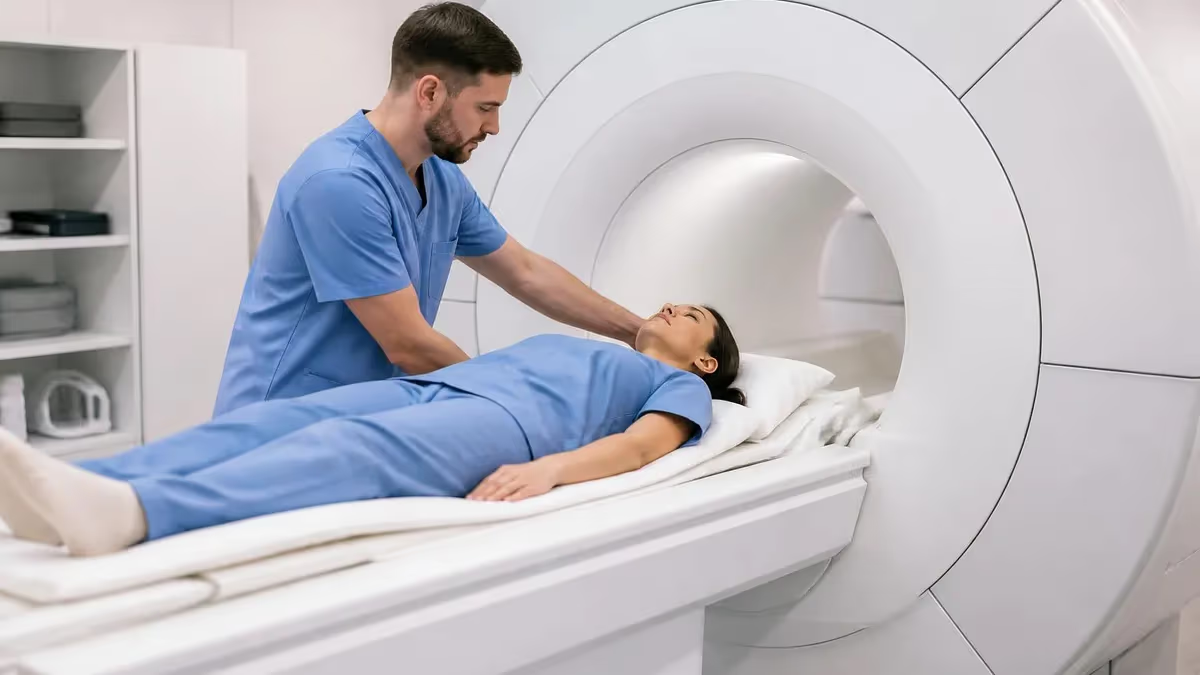
T1 vs T2 — The Numbers That Matter
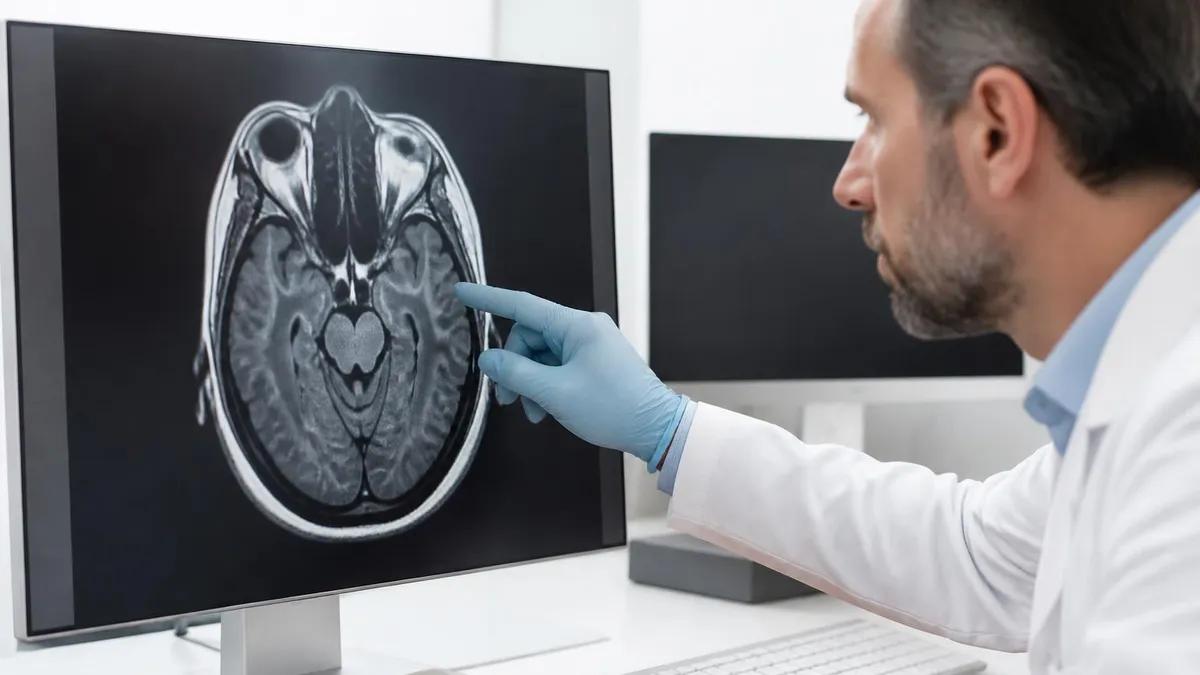
T1 and T2 MRI — The Two Sequences That Built Modern Imaging
T1 and T2 aren't scanners. They're not contrast agents either. They're relaxation times — the way your tissues' hydrogen atoms recover after a radiofrequency pulse. Different tissues recover at different speeds, and that difference is what lets MRI tell fat from water from muscle from tumor.
Here's the short version. T1 measures how fast protons realign with the main magnetic field after being knocked sideways. T2 measures how fast protons lose phase coherence with each other in the transverse plane. Both happen at the same time, but the machine can weight an image toward one or the other by adjusting two settings: TR (repetition time) and TE (echo time).
Short TR plus short TE produces a T1-weighted image. Long TR plus long TE produces a T2-weighted image. That's the whole machine — at least at this level. The rest is interpretation.
If you're studying for the mri sequences portion of an ARRT or registry exam, this is the foundation. Every other sequence you'll meet later — STIR, FLAIR, DWI, PD — is a clever modification of these two basic ideas. Lock T1 and T2 down first and the rest gets easier.
Why do we care? Because the human body is mostly water and fat. On a T1 image fat lights up white. On a T2 image water lights up white. That single fact is what radiologists use to spot edema, tumors, demyelination, hemorrhage, and a dozen other things. The contrast between healthy and diseased tissue lives in the gap between T1 and T2 signal patterns. Get the gap. Get the diagnosis.
Worth knowing up front: T1 and T2 aren't competitors. You almost always order both. A complete brain MRI protocol includes T1 axial, T2 axial, FLAIR, DWI, and often a post-contrast T1. Spine MRIs use sagittal T1 and T2. Knee MRIs combine T1 and proton density with fat-suppressed T2. The two sequences are designed to complement each other — what looks dark on one often looks bright on the other, and that asymmetry is the diagnostic gold.
WW2 — Water is bright on T2. Two W's, like the war. Whenever you see a bright fluid-filled structure (CSF, bladder, edema, cysts), you're looking at a T2 image. Pair it with FF1 — Fat is bright on T1 and you've solved 80% of "which sequence is this?" questions on the spot. Memorize these two lines and the rest of MRI reading becomes pattern recognition.
T1 vs T2 — Tissue Contrast Side by Side
T1: white matter brighter than gray matter (myelin = fat-like). T2: gray matter brighter than white matter (more water). The contrast flips between sequences — that's your fast orientation check.
T1: dark (almost black). T2: very bright white. CSF is the classic water test — if ventricles are bright, you're on T2. If they're dark, you're on T1.
T1: bright. T2: intermediate to bright (still fairly bright on standard T2). Use fat-suppression sequences to remove the fat signal and isolate pathology.
Hyperacute hemorrhage (<12 hr): T1 isointense, T2 hyperintense. Hemorrhage signal evolves predictably over hours to weeks — a whole stroke-aging algorithm is built on it.
T1: intermediate gray. T2: intermediate to slightly darker than fat. Muscle is the typical "middle gray" reference tone for most musculoskeletal MRIs.
Both are signal voids — black on T1 and T2. MRI doesn't "see" cortical bone the way CT does. For fractures, you read marrow edema on STIR or T2 fat-sat instead.
T1: dark to intermediate. T2: bright. Edema is the bread-and-butter T2 finding — surrounding stroke, tumor, infection, trauma. If it's bright on T2 and you suspect a lesion, edema is your bet.
T1: hypointense (dark) relative to surrounding tissue. T2: hyperintense (bright). Post-contrast T1 with gadolinium often shows enhancement — diagnostic gold for solid tumors.
Gadolinium shortens T1 dramatically — enhancing tissues light up bright on post-contrast T1 images. You almost never look at gadolinium on T2 because the effect is subtle there.
T1 vs T2 — Decision Tabs for Daily Reading
Reach for T1 when you need anatomy. The contrast between gray and white matter is best on T1. Use it for structural overview of the brain, for marrow signal in the spine, and for any post-contrast study where you're looking at gadolinium enhancement.
T1 also reveals subacute hemorrhage beautifully — methemoglobin shortens T1 and shows bright. And fat-containing lesions (lipomas, dermoids) jump out on T1 because fat is bright there. Anatomy, fat, contrast, subacute blood. That's the T1 menu.
Mnemonics, Tricks, and the Fast Orientation Check
You'll be asked "which sequence is this?" hundreds of times — on exams, on rounds, in front of attendings. Speed matters. Here's the fast hierarchy of checks.
Step 1: Find the CSF
Look at the ventricles or the spinal canal. CSF is the easiest landmark in the entire body. Bright CSF = T2. Dark CSF = T1 or FLAIR. Two seconds. Done.
Step 2: Confirm with Fat
If the answer above was T1, fat should be bright. Look at the scalp, the orbital fat, or the subcutaneous tissue. Bright = consistent with T1. If fat is bright AND CSF is dark, you've got T1.
If the answer was T2 and CSF is bright, fat will be intermediate (still fairly bright on standard T2 but not as bright as the fluid). On fat-suppressed T2, fat is dark and pathology water shines even brighter.
Step 3: Distinguish T2 from FLAIR
This trips people up. Both show pathology bright. But FLAIR suppresses CSF — so on FLAIR the ventricles are dark even though the rest of the image looks T2-weighted. If you see dark CSF but bright periventricular white matter changes (like MS plaques), you're on FLAIR.
The Quick Reference
Here's the cheat sheet most residents tape inside their lockers. T1: anatomy, fat bright, CSF dark, gray darker than white. T2: pathology, water bright, fat intermediate, gray brighter than white. FLAIR: T2 minus CSF (water dark, lesions still bright). STIR: T2 minus fat (water bright, fat suppressed dark).
Why the Image Always Looks "Wrong" at First
Beginners always feel like the contrast is inverted. That's because brain MRI shows gray and white matter with reversed brightness compared to gross anatomy you learned in school. White matter is the lighter tissue (myelinated, fat-like, short T1) — so it appears brighter than gray matter on T1. On T2, gray matter (more water content, longer T2) appears brighter. The brain looks like a photographic negative of itself between the two sequences. Get used to it. Once it clicks, it stays clicked.
The 2-Second Reading Sequence
Take any new MRI image. Find CSF. Bright? T2 family. Dark? T1 family. Confirm with fat. Confirm with white matter. Three checks. Less than 5 seconds. You're now oriented on every single MRI you'll ever look at.
Where the Mnemonics Break Down
WW2 and FF1 work 95% of the time. The 5% where they fail: fat-suppressed T2 (fat is dark), T2 with gadolinium artifact, or unusual fluid contents like proteinaceous cysts (which can be T1-bright instead of dark). When the mnemonic looks wrong, check the sequence label. The scanner always records it in the DICOM header — radiologists usually display it as text overlay on the lower corner of each image.
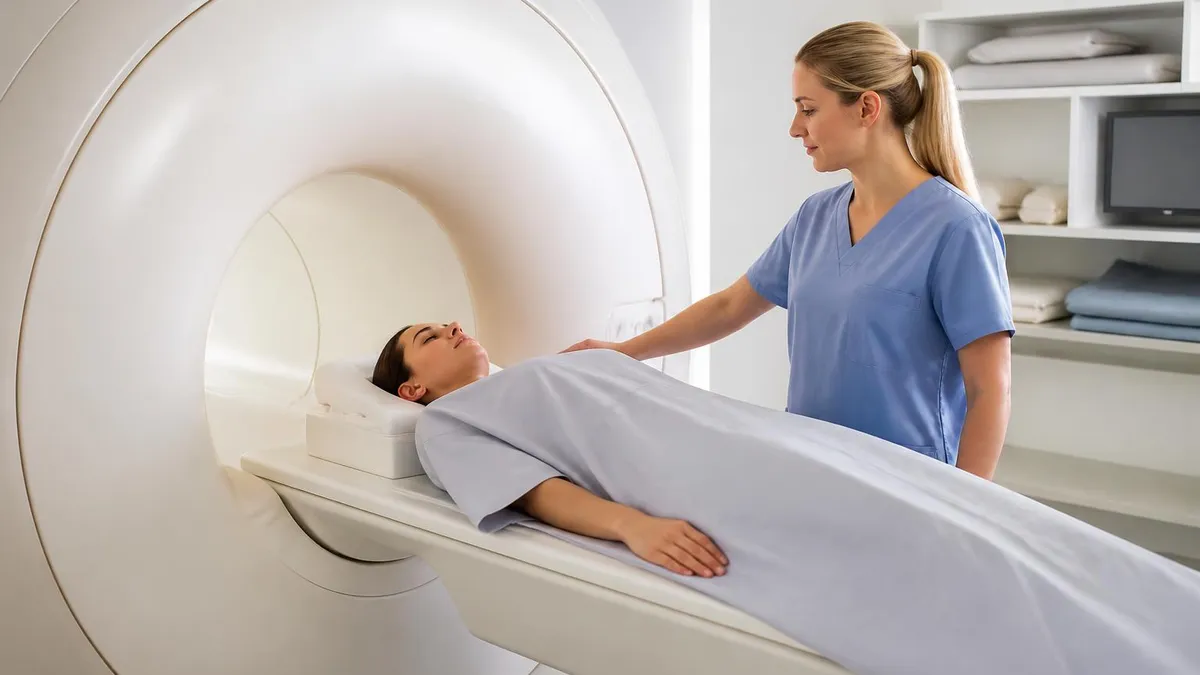
The 5-Second Sequence Orientation Check
- ✓Find CSF or another large fluid pocket. Bright = T2, dark = T1.
- ✓Check fat (scalp, subcutaneous, orbital). Bright fat confirms T1.
- ✓Check gray vs white matter. T1: white > gray brightness. T2: gray > white.
- ✓Look for sequence label in image corner (T1, T2, FLAIR, STIR).
- ✓If CSF is dark but pathology is bright → FLAIR, not T1.
- ✓If fat is dark but fluid is bright → fat-suppressed T2 or STIR.
- ✓Check for contrast administration (gadolinium → bright enhancement on T1).
- ✓Confirm orientation: axial, sagittal, coronal — labeled in DICOM header.
STIR, FLAIR, and PD — The Sequences That Build on T1 and T2
Once you've locked down T1 and T2, the other common sequences are easier to parse. Each one is a modification designed to suppress one tissue type and highlight another.
STIR (Short Tau Inversion Recovery)
STIR is essentially T2 with fat suppression. The sequence uses an inversion pulse timed to null fat signal — so fat appears dark while water and pathology stay bright. STIR is the go-to sequence for marrow edema, occult fractures, soft-tissue infection, and any musculoskeletal MRI where fat would otherwise mask the pathology.
Practical use: a foot MRI with suspected stress fracture. On T1, the marrow looks normal. On STIR, you see a bright signal where the cortical break and the surrounding edema sit. The lesion that was invisible on T1 jumps off the screen.
FLAIR (Fluid-Attenuated Inversion Recovery)
FLAIR is T2 with water (specifically CSF) suppression. The inversion pulse here is timed to null free water. So CSF is dark — but tissue water (edema, gliosis, demyelination) stays bright. This is the workhorse sequence for multiple sclerosis. MS plaques sitting next to the ventricles would be invisible on regular T2 because the bright CSF would camouflage them. On FLAIR, the CSF goes dark and the plaques shine.
FLAIR is also critical in acute stroke. You compare DWI to FLAIR: DWI positive + FLAIR negative = lesion under 4.5 hours old (within tPA window). DWI positive + FLAIR positive = lesion older than 6 hours. This is sometimes called the DWI-FLAIR mismatch and it guides thrombolysis decisions in patients with unknown stroke onset time.
PD (Proton Density)
PD is the "in-between" sequence — long TR, short TE. It minimizes both T1 and T2 weighting and shows tissue based on raw proton concentration. Tissues with more hydrogen atoms appear brighter. Used heavily in musculoskeletal imaging, especially knee and shoulder cartilage. PD with fat suppression is the workhorse for meniscal and articular cartilage assessment.
DWI (Diffusion-Weighted Imaging)
DWI measures water motion. Restricted diffusion (cytotoxic edema in acute stroke, abscess, hyperviable tumor) shows bright. Free diffusion shows dark. Always paired with an ADC map to confirm — bright on DWI plus dark on ADC equals true restricted diffusion. Learn more in the diffusion weighted mri guide if you want to go deeper.
Quick Summary Table
T1 = anatomy (fat bright, CSF dark). T2 = pathology (water bright, fat intermediate). STIR = T2 minus fat (fluid pops, fat suppressed). FLAIR = T2 minus free water (lesions pop near ventricles). PD = proton concentration (cartilage and ligaments). DWI = water motion (acute stroke, abscess).
How Radiologists Actually Order These
A typical brain MRI protocol: T1 axial, T2 axial, FLAIR axial, DWI axial, post-contrast T1 axial. Five sequences, 20–30 minutes of scanner time, comprehensive coverage of nearly every brain pathology. Knee MRI: PD sagittal, T2 fat-sat sagittal, T1 coronal, PD coronal, T2 fat-sat axial. Each sequence carries a job. Removing one creates a blind spot.
The Stir vs FLAIR Confusion
Beginners conflate STIR and FLAIR. Both are inversion-recovery sequences. Both suppress something. The difference is what they suppress. STIR suppresses fat (short tau, ~150 ms). FLAIR suppresses free water (long tau, ~2500 ms). STIR is used in body and musculoskeletal MRI; FLAIR is used in the brain. The mri stir sequence guide breaks down the physics for those who want depth.
Clinical Use by Body Part
DWI + ADC (gold standard <6 hours). T2 FLAIR for older infarcts. T1 to rule out hemorrhage mimics. T2* or SWI for microbleeds. Avoid contrast if possible — adds time when minutes matter.
Pre-contrast T1, T2, FLAIR, DWI, post-contrast T1. Enhancement pattern on post-contrast T1 plus DWI restriction (for high-grade) and edema on T2 builds the differential.
T2 + FLAIR for plaques. T1 to identify chronic black holes (axonal loss). Post-contrast T1 for active inflammation (enhancing plaques = active demyelination). McDonald 2017 criteria.
Sagittal T1 + sagittal T2 + axial T2. T2 shows disc herniation, cord edema, ligament injury. T1 shows marrow, fat planes, and post-op metalwork. Axial T2 confirms cord vs root compression.
Sagittal T2 = disc hydration (dark disc = degenerated). Sagittal T1 = marrow Modic changes. Axial T2 = nerve root impingement. STIR for marrow edema after trauma or in suspected infection.
PD sagittal + T2 fat-sat sagittal + coronal. PD shows meniscal tears. T2 fat-sat highlights bone bruise, ACL/PCL tears, and chondral defects. The standard knee protocol is built around T2 + PD, not T1.
What an MRI Actually Costs (US Averages)
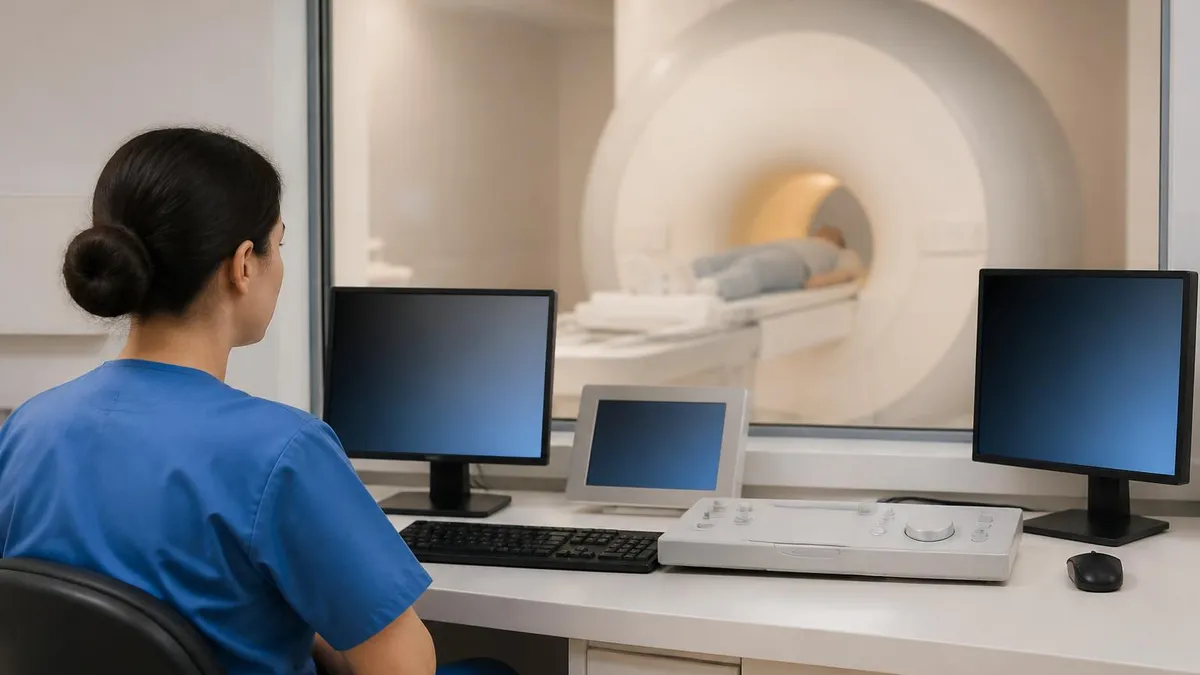
Reading a T1 and T2 MRI Step by Step
Imagine you're looking at a new brain MRI for the first time. Here's the workflow most attendings use.
Step 1: Open T1 First (Anatomy)
Get oriented. Confirm normal ventricles, normal gray-white matter differentiation, normal cortical thickness. Note any incidental lesions, sinus disease, mastoid changes, or skull-base abnormalities. T1 is your map. Use it.
Step 2: Move to T2 (Pathology Hunt)
Now look for anything that's brighter than it should be. Hyperintense T2 signal = water = edema, gliosis, demyelination, or tumor. Scan top to bottom, left to right, in axial slices. Don't skip the periventricular white matter or the basal ganglia — common sites for MS, lacunar infarcts, and microvascular disease.
Step 3: Cross-Reference with FLAIR
FLAIR shows the same pathology as T2 but with CSF suppressed. Lesions adjacent to ventricles become visible. This is where MS plaques typically hide on T2 but jump off the screen on FLAIR. Comparing T2 to FLAIR also helps distinguish true lesions from CSF flow artifact.
Step 4: Check DWI for Restriction
If acute stroke is on the differential, DWI is the answer. Bright on DWI + dark on ADC = restricted diffusion = acute infarct or abscess or hyperviable tumor. Don't be fooled by T2 shine-through (bright DWI from a longstanding T2 lesion without true restriction) — always confirm with ADC.
Step 5: Post-Contrast T1
If contrast was given, this is where you spot enhancing lesions. Tumors, active MS plaques, infections, and abscess walls all enhance. Compare pre- to post-contrast T1 to confirm the enhancement is real and not just T1-bright methemoglobin or fat.
Step 6: Report Generation
Radiologists write reports in a structured format. Each finding is described in terms of T1 signal, T2 signal, enhancement pattern, size, location, and surrounding mass effect. A typical lesion description: "T1 hypointense, T2 hyperintense, peripherally enhancing 2.3 cm lesion in the right frontal lobe with surrounding vasogenic edema and mild mass effect on the right lateral ventricle." Every word carries meaning.
Step 7: Compare to Priors
If a prior MRI exists, compare. Stable lesion or new lesion? Growing or shrinking? Same enhancement pattern? Comparison is often more diagnostic than the new study alone. This is the radiologist's real edge over AI tools — pattern recognition across time.
How Long Does All of This Take?
A staff radiologist reads a complete brain MRI in 4–8 minutes during normal workflow. Residents take 20–40 minutes early in training. The protocol-by-protocol workflow above becomes muscle memory after about 200–300 studies. Volume builds speed. There's no shortcut.
Brain MRI vs Spine MRI Workflow Differences
Brain reads are sequence-by-sequence (T1 then T2 then FLAIR then DWI then post-contrast). Spine reads are plane-by-plane (sagittal first to get the whole column, then axial through suspected levels). Different organs, different reading habits. A brain mri scan can be read fast because anatomy is symmetric. Spine takes longer because you're checking 5–7 disc levels individually.
T1 vs T2 — Strengths and Weaknesses
Each sequence does one job well. Neither replaces the other.
- +Best for normal anatomy and gray-white matter contrast
- +Bright fat — ideal for lipomas, dermoids, marrow assessment
- +Bright subacute hemorrhage (methemoglobin shortens T1)
- +Post-contrast T1 shows gadolinium enhancement clearly
- +Higher spatial resolution typically achievable per shot
- +Faster acquisition times (short TR) — efficient for screening
- −Most sensitive sequence for pathology (water-rich lesions)
- −Bright CSF = easy orientation landmark
- −Detects edema, inflammation, demyelination, cysts, tumors
- −Workhorse for spine disc evaluation and joint effusions
- −Fluid-sensitive — picks up early disease before T1 changes
- −Foundation for FLAIR and STIR derivative sequences
T1 and T2 Through History — A Quick Timeline
1946
1971
1973
1977
1980s
1990s–2026
Common Pitfalls and Edge Cases
Even experienced readers get tripped up by certain MRI quirks. Here are the most common ones — worth knowing before they bite you on a real read.
Pitfall 1: Proteinaceous Cysts Look T1-Bright
Most cysts are dark on T1 and bright on T2. But protein-rich cyst contents (Rathke's cleft cyst, hemorrhagic ovarian cyst, dermoid) can be T1-bright. If you see a T1-bright lesion that's not fat and not subacute blood, think protein.
Pitfall 2: T2 Shine-Through on DWI
A bright DWI signal doesn't automatically mean restricted diffusion. T2-bright lesions can "shine through" on DWI even without restriction. Always pair DWI with the ADC map. True restriction = bright DWI + dark ADC. T2 shine-through = bright DWI + bright or normal ADC.
Pitfall 3: Fat on Fat-Suppressed T2 Looking Like Tumor
If the fat-suppression pulse fails (uneven shimming, off-center positioning, metallic implant nearby), residual fat signal looks bright on T2 fat-sat — mimicking pathology. Check the whole image for uneven fat suppression before calling a lesion. Spot fat-suppression failure by checking the periphery of the field of view.
Pitfall 4: Gadolinium and Subacute Blood Both Look T1-Bright
If a patient was scanned without contrast and shows a T1-bright lesion, don't assume enhancement — it could be subacute hemorrhage. Always compare pre- and post-contrast images. New bright signal on post-contrast = enhancement. Existing bright signal on pre-contrast = blood, fat, or protein.
Pitfall 5: Confusing FLAIR with T1
Both have dark CSF. Beginners frequently call FLAIR a "T1" because of the dark ventricles. The distinguishing feature: FLAIR shows bright lesions (T2-weighted underneath), while true T1 shows lesions dark or isointense. If white matter pathology lights up bright while CSF is dark, you're on FLAIR.
Pitfall 6: Motion Artifact on T2
T2 sequences are long (3–5 minutes per acquisition). Patient motion blurs everything. If you see ghosting in the phase-encoding direction or smeared anatomy, blame motion before you blame pathology. Repeat the sequence with breath-holding or sedation if needed.
Pitfall 7: Metallic Artifact
Hardware (hip replacement, dental fillings, spinal fusion) creates signal void plus distortion around the metal. T2 with fat suppression amplifies the artifact. T1 spin-echo is more forgiving. STIR is most affected. If you must image around metal, use STIR alternatives like SPAIR or specialized MARS (Metal Artifact Reduction Sequence) protocols.
Pitfall 8: Susceptibility on T2*
T2* (T2 star) is a gradient-echo variant that picks up susceptibility artifact from iron, calcium, and air. Hemosiderin from old bleeds shows as blooming hypointensity on T2*. SWI (susceptibility-weighted imaging) is the modern enhanced version. Don't confuse T2* with T2 — they read very differently.
When to Get the Tech to Re-scan
If a sequence is non-diagnostic (motion, wrong slice angle, missed coverage), ask the technologist to re-scan that sequence. Most modern scanners allow targeted re-acquisition without redoing the full study. A 3-minute re-scan beats a non-diagnostic report.
How to Spot a Bad Protocol
Sometimes the ordering physician requests the wrong protocol. If you see a knee MRI with only T1 and no PD or fat-sat T2, that's a bad protocol — meniscus and cartilage will be invisible. Call the tech, ask for the missing sequences, and add them before the patient leaves. Catching this in real time saves the patient a repeat trip.
MRI Questions and Answers
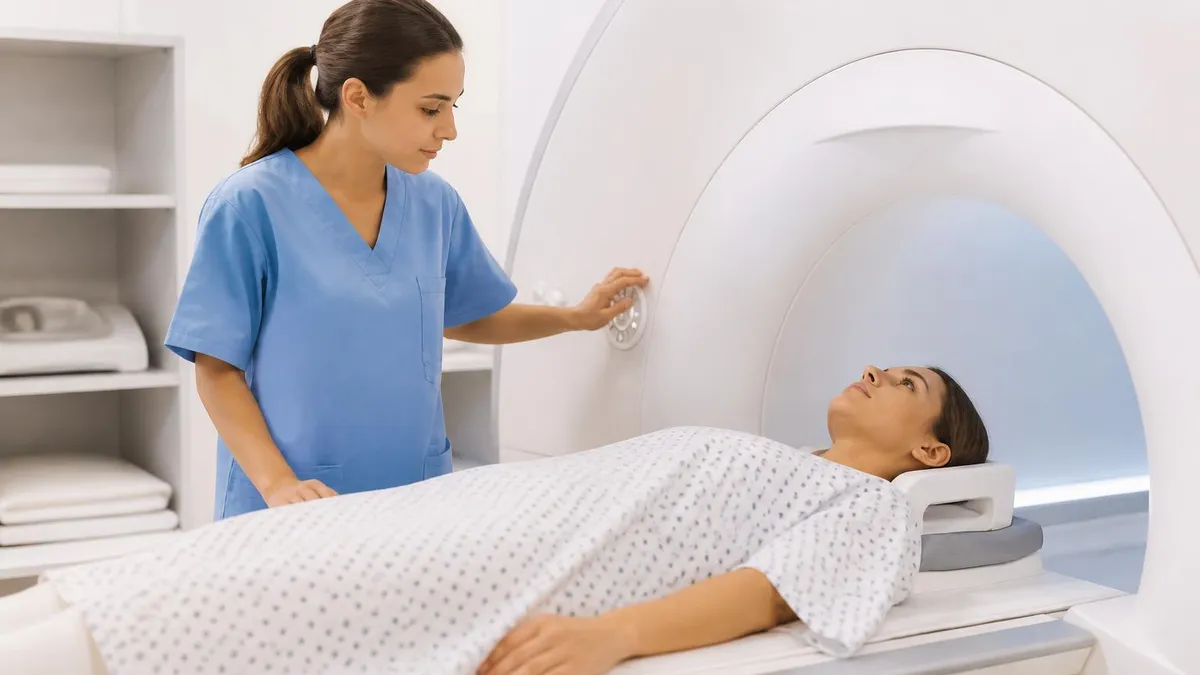
MRI of Short- and Ultrashort-T2 Tissues: Sequences, Protocols, and Clinical Applications
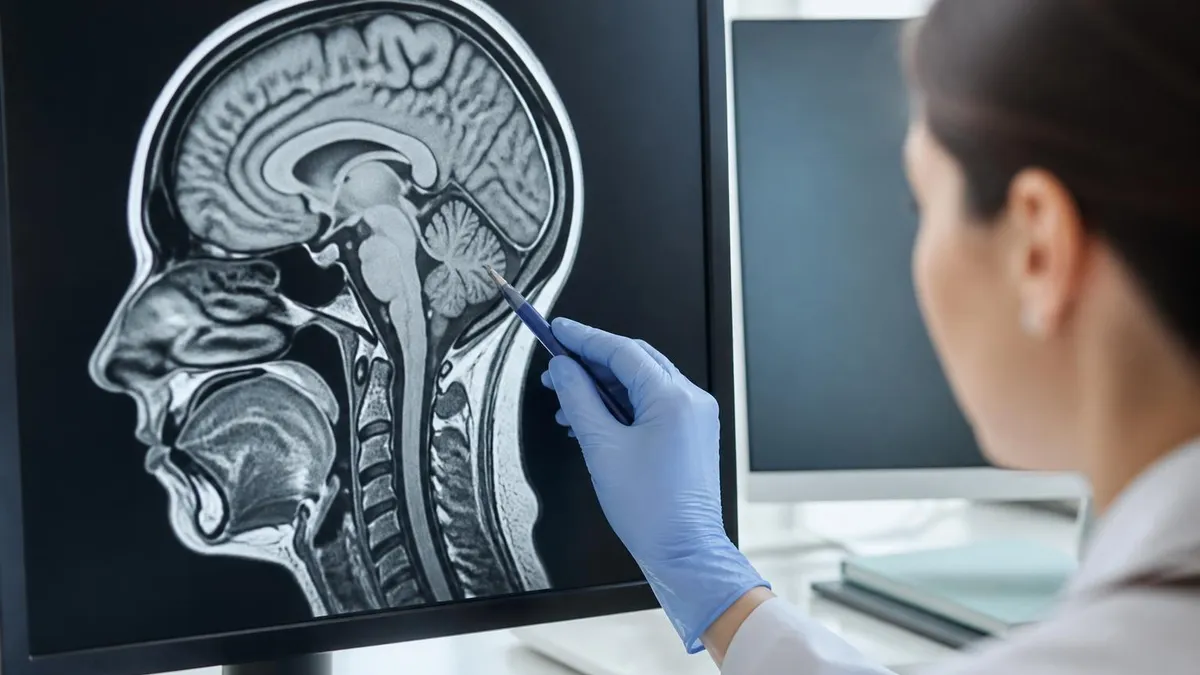
Diffusion Weighted MRI: How DWI Works, Sequences and Clinical Uses
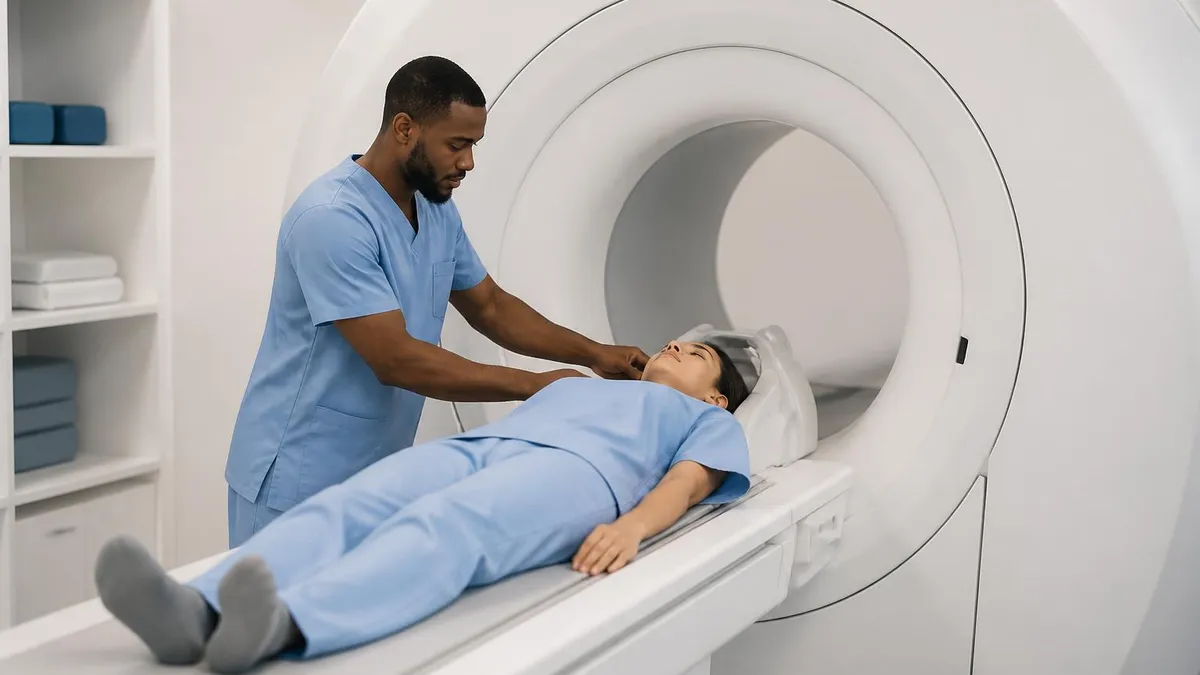
MRI STIR Sequence: A Complete Guide to Short Tau Inversion Recovery Imaging
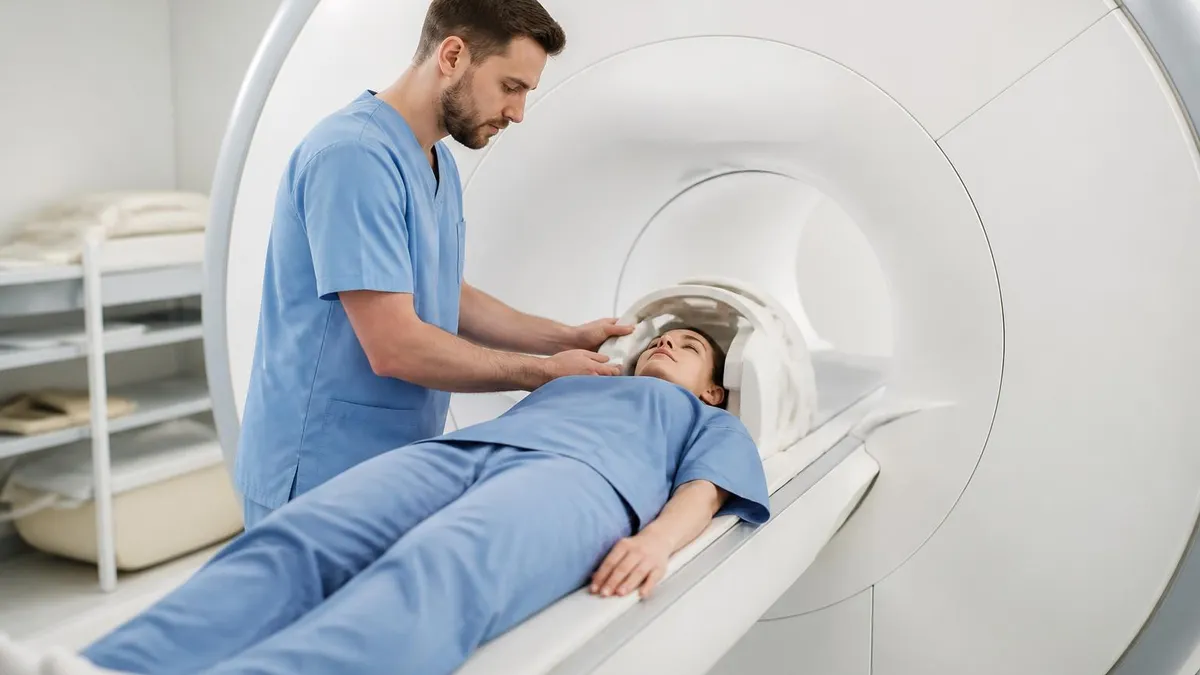
Brain MRI Scan: What It Shows, Sequences and Preparation Guide
Multiple Sclerosis MRI: McDonald Criteria, Lesion Patterns and Protocols (2026 Guide)
MRI Contrast: Gadolinium Agents and Patient Considerations
About the Author

Medical Laboratory Scientist & Clinical Certification Expert
Johns Hopkins UniversityDr. Sandra Kim holds a PhD in Clinical Laboratory Science from Johns Hopkins University and is certified as a Medical Technologist (MT) and Medical Laboratory Scientist (MLS) through ASCP. With 16 years of clinical laboratory experience spanning hematology, microbiology, and molecular diagnostics, she prepares candidates for ASCP board exams, MLT, MLS, and specialist certification tests.
Join the Discussion
Connect with other students preparing for this exam. Share tips, ask questions, and get advice from people who have been there.
View discussion (8 replies)