
HVAC System Diagram: A Complete Visual Guide to How Heating and Cooling Systems Work
Learn how to read an hvac system diagram. Understand every component, ⏳ airflow path, and refrigeration cycle with clear explanations for technicians and...

An hvac system diagram is the single most powerful learning tool available to anyone studying heating, ventilation, and air conditioning — whether you are a homeowner trying to understand a repair quote, a student preparing for certification exams, or a working technician troubleshooting a complex commercial installation. These diagrams lay out every component, every refrigerant line, every control wire, and every duct branch in a format that words alone simply cannot replicate. Reading them fluently separates guesswork from precision diagnostics.
At their core, HVAC system diagrams communicate four overlapping systems at once: the refrigeration cycle, the air distribution network, the electrical control circuit, and the hydronic or combustion loop (depending on system type). Each of these subsystems has its own visual language — solid lines for refrigerant, dashed lines for control wiring, thick arrows for airflow — and learning to decode that language is a foundational skill for every HVAC professional. Mastery of diagram reading is tested on most state and national certification exams.
Residential split systems are the most common configuration covered on HVAC diagrams in the United States. In a standard split system, the condensing unit sits outdoors and houses the compressor, condenser coil, and condenser fan. The air handler or furnace sits indoors and contains the evaporator coil, blower motor, and, in gas systems, the heat exchanger. Refrigerant lines — one insulated suction line and one smaller liquid line — connect the two halves of the system and carry heat energy between them throughout the refrigeration cycle.
Package units consolidate every component into a single cabinet installed on the roof or a concrete pad beside the building. While physically simpler than split systems, their diagrams can look more complex because refrigerant, electrical, and duct connections all terminate at a single unit. Technicians who work primarily on residential split systems sometimes find package unit diagrams disorienting until they recognize that the underlying refrigeration and electrical logic is identical — only the physical layout differs. Mini-split and variable refrigerant flow (VRF) systems add additional complexity with multiple indoor heads and sophisticated inverter controls.
Understanding the airflow path shown on a diagram is just as important as understanding the refrigerant circuit. Return air is drawn from conditioned spaces through return grilles and ductwork back to the air handler. It passes through the filter, across the evaporator coil (for cooling) or the heat exchanger (for heating), and is then pushed by the blower through supply ductwork and out through supply registers into each room. A well-drawn system diagram will show static pressure measurement points, balancing dampers, zone control boards, and bypass ducts — all critical for commissioning and troubleshooting work.
For those preparing to enter the HVAC workforce, studying system diagrams alongside hands-on lab work dramatically accelerates comprehension. You can also explore how diagram knowledge applies in commercial contexts on our hvac system diagram resource page, which covers real-world system selection and specification. The ability to interpret a wiring schematic or refrigerant piping diagram on the job — without needing to call a supervisor — is consistently cited by HVAC employers as one of the most valuable skills a new hire can bring to the shop.
This guide walks through every major category of HVAC system diagram: the refrigeration cycle diagram, the wiring schematic, the ductwork layout, and the piping isometric. For each type, we explain the symbols, the reading sequence, and the most common errors students and technicians make when interpreting them. Whether you are preparing for the EPA 608 exam, a state journeyman license, or simply want to understand the system in your own home, the sections below provide the foundation you need.
HVAC System Diagrams by the Numbers

Core Components Shown on Every HVAC System Diagram
The heart of the refrigeration cycle. The compressor raises refrigerant pressure and temperature so heat can be rejected at the condenser. Diagrams show it as a circle with inlet and outlet ports. Hermetic compressors are the most common type in residential systems.
The two heat exchangers in the system. The condenser (outdoor) rejects heat; the evaporator (indoor) absorbs it. Diagrams represent coils as serpentine lines with fin symbols. Airflow direction arrows across each coil are critical for understanding heat transfer direction.
The metering device — a TXV, EEV, or fixed orifice — drops refrigerant pressure between the liquid line and the evaporator. On diagrams it appears as a triangle or valve symbol. Its position in the circuit defines the boundary between high-side and low-side pressure.
Contains the evaporator coil, blower motor, and filter rack. On system diagrams the blower is shown as a fan wheel symbol with inlet and outlet duct connections. CFM ratings and external static pressure values are typically noted alongside this component on commissioning diagrams.
The electrical brain of the system. Wiring diagrams show the thermostat terminals (R, C, Y, W, G, O/B) and trace 24V signals to the control board, contactor coil, and reversing valve solenoid. Color-coded wire legends are included on most manufacturer schematics.
The refrigeration cycle diagram is the starting point for understanding how any vapor-compression HVAC system works. Beginning at the compressor, low-pressure, low-temperature refrigerant vapor enters the suction port and is compressed into a high-pressure, high-temperature superheated vapor. This hot gas then flows through the discharge line to the condenser coil, where the condenser fan forces ambient air across the fins and tubes, removing heat from the refrigerant until it condenses into a high-pressure liquid. The temperature drop across the condenser — called subcooling — is measured in degrees Fahrenheit and appears as a target value on manufacturer charging charts.
From the condenser, the high-pressure liquid travels through the liquid line to the expansion device. Whether the system uses a thermostatic expansion valve (TXV), an electronic expansion valve (EEV), or a fixed orifice, the expansion device's job is the same: restrict refrigerant flow to create a pressure drop.
On the low-pressure side of the expansion device, the refrigerant becomes a cold, low-pressure liquid-vapor mixture. This cold mixture enters the evaporator coil, where warm return air passes across the fins, causing the refrigerant to boil and absorb heat energy. The temperature difference between the refrigerant and the air — called superheat — is one of the most important diagnostic measurements in the trade.
Reading a refrigeration cycle diagram requires understanding which lines represent high-side pressure and which represent low-side pressure. High-side components include the compressor discharge port, the discharge line, the condenser coil, the liquid line, and the inlet of the expansion device. Low-side components include the outlet of the expansion device, the evaporator coil, the suction line, and the suction port of the compressor. Most textbook diagrams color-code these zones — red for high side, blue for low side — making the pressure boundary at the expansion device immediately obvious to the reader.
Refrigerant state changes are often annotated directly on professional diagrams using a pressure-enthalpy chart reference. At the compressor inlet, the refrigerant is a superheated vapor. After compression it is a hot superheated vapor at high pressure. After the condenser it is a subcooled liquid. After the expansion device it is a two-phase mixture. After the evaporator it returns to superheated vapor, completing the cycle. Understanding these four states and where each transition occurs on the physical diagram is essential for interpreting service data and for passing refrigeration theory questions on certification exams.
Heat pump diagrams add a fifth major component: the reversing valve. In cooling mode, the reversing valve directs hot discharge gas to the outdoor coil (which acts as the condenser) and allows the indoor coil to act as the evaporator, absorbing heat from the house.
In heating mode, the reversing valve shifts position, directing hot discharge gas to the indoor coil so it becomes the condenser, releasing heat into the building. The outdoor coil becomes the evaporator, absorbing heat from outdoor air even at temperatures well below freezing. Technicians reading heat pump diagrams must always identify the operating mode before interpreting pressure and temperature readings.
Refrigerant identification has become increasingly important as the industry transitions away from older refrigerants. Older systems using R-22 are being replaced with R-410A systems, and now R-32 and R-454B systems are entering the market as lower global warming potential alternatives. Each refrigerant has different operating pressures, so a diagram annotated with expected suction and discharge pressures for R-410A will show values roughly double those of an equivalent R-22 system. When reading a system diagram, always confirm the refrigerant type before interpreting any pressure or temperature annotations, since using the wrong refrigerant's pressure-temperature chart will lead to a misdiagnosis every time.
Manufacturers publish detailed refrigeration cycle diagrams in their installation and service manuals, and these documents are freely available on most manufacturer websites. Studying the diagrams for two or three specific equipment models — rather than relying only on generic textbook diagrams — gives you a far more practical understanding of how real-world systems differ from idealized illustrations.
Pay particular attention to the location of service valves, Schrader ports, and sight glasses, since these are the access points you will use when taking measurements during an actual service call. Practice reading these diagrams until you can trace the refrigerant path from compressor to compressor without hesitation.
HVAC Practice Test Questions
Prepare for the HVAC - Heating Ventilation and Air Conditioning exam with our free practice test modules. Each quiz covers key topics to help you pass on your first try.
HVAC Air Conditioning
HVAC Exam Questions covering Air Conditioning. Master HVAC Test concepts for certification prep.
HVAC Code Compliance
Free HVAC Practice Test featuring Code Compliance. Improve your HVAC Exam score with mock test prep.
HVAC Electrical Controls
HVAC Test Prep for Electrical Controls. Practice HVAC Quiz questions and boost your score.
HVAC Energy Efficiency
HVAC Questions and Answers on Energy Efficiency. Free HVAC practice for exam readiness.
HVAC Heating Systems
HVAC Mock Test covering Heating Systems. Online HVAC Test practice with instant feedback.
HVAC Load Calculations
Free HVAC Quiz on HVAC Load Calculations. HVAC Exam prep questions with detailed explanations.
HVAC Tools and Equipment
HVAC Practice Questions for HVAC Tools and Equipment. Build confidence for your HVAC certification exam.
HVAC Refrigeration
HVAC Test Online for Refrigeration. Free practice with instant results and feedback.
HVAC Safety Practices
HVAC Study Material on Safety Practices. Prepare effectively with real exam-style questions.
HVAC System Design
Free HVAC Test covering System Design. Practice and track your HVAC exam readiness.
HVAC Thermodynamics
HVAC Exam Questions covering Thermodynamics. Master HVAC Test concepts for certification prep.
Three Types of HVAC Wiring Diagrams Every Technician Must Know
A ladder diagram (also called a line diagram or schematic diagram) arranges all electrical components between two vertical power rails, with each control circuit forming a horizontal rung between them. Every load — compressor contactor coil, condenser fan motor, blower relay — appears on its own rung, and every switch, thermostat contact, or safety device in series with that load is drawn inline on the same rung. Reading left to right shows you exactly what conditions must be satisfied for a specific load to energize.
Ladder diagrams are the preferred format for troubleshooting because they eliminate physical wiring clutter and focus entirely on circuit logic. When the Y signal from the thermostat is present but the compressor contactor is not pulling in, a technician traces the Y-to-contactor rung on the ladder diagram and identifies every series component — high-pressure switch, low-pressure switch, time-delay relay — until the open circuit is found. This systematic approach is far faster than probing random wires in the electrical compartment and is why ladder diagrams are emphasized on journeyman license exams across the country.

Digital HVAC Diagrams vs. Printed Field Schematics: What Works Best?
- +Digital diagrams on tablets zoom in to show terminal numbers and wire gauges that are illegible on printed versions
- +Manufacturer apps and online portals provide the most current diagram revisions, eliminating outdated field copies
- +Interactive digital diagrams can hyperlink component names to installation specs and fault code tables
- +Cloud-stored diagrams are accessible from any device on the job site without carrying a paper set
- +Digital format allows technicians to annotate pressure and temperature readings directly on the diagram during diagnostics
- +Training platforms can embed quizzes and guided walkthroughs into digital diagrams for apprentice learning
- −Tablets and phones can run out of battery or lose signal in mechanical rooms with poor reception
- −Glare, dust, and grease make screens harder to read in harsh mechanical room environments
- −Not every older unit has a digital diagram available, requiring research time on the job site
- −Apprentices who rely exclusively on digital diagrams sometimes struggle to read printed schematics during licensing exams
- −Touchscreen interaction while wearing work gloves is slow and frustrating, slowing down the diagnostic process
- −Some manufacturers' apps require paid subscriptions or registration, adding cost and friction for independent technicians
HVAC System Diagram Reading Checklist: 10 Steps Before You Pick Up a Gauge
- ✓Identify the refrigerant type listed on the diagram and confirm it matches the equipment nameplate.
- ✓Locate and label the high-side and low-side pressure boundaries at the expansion device.
- ✓Trace the complete refrigerant path from compressor outlet back to compressor inlet.
- ✓Find all four state changes — superheated vapor, high-pressure vapor, subcooled liquid, two-phase mixture.
- ✓Identify every electrical safety device (high-pressure switch, low-pressure switch, thermal overload) on the wiring schematic.
- ✓Confirm thermostat terminal assignments and trace each signal wire to its destination on the control board.
- ✓Locate all service valve and Schrader port positions for gauge manifold connection.
- ✓Read the ductwork layout diagram to identify supply and return duct trunk sizes and branch takeoff locations.
- ✓Check for any field-installed accessories (UV lights, humidifiers, economizers) that may alter the standard wiring diagram.
- ✓Note manufacturer-specified superheat and subcooling target values before taking any refrigerant measurements.
Superheat and Subcooling Are Diagram Checkpoints, Not Just Measurements
Most HVAC certification exam questions that reference system diagrams are actually testing whether you understand superheat at the evaporator outlet and subcooling at the condenser outlet — not just that you can define them. Practice identifying these measurement points on different diagram types: a correctly charged system shows 10–20°F superheat at the suction line service valve and 10–15°F subcooling at the liquid line service valve. If you can locate these points instantly on any diagram, a large category of exam questions becomes straightforward.
Ductwork layout diagrams are among the most practically useful documents in the HVAC trade, yet they receive far less attention in training programs than refrigeration cycle or wiring diagrams. A duct layout diagram shows the air distribution system in plan view — typically overlaid on an architectural floor plan — with trunk ducts, branch ducts, supply registers, return grilles, and the air handler all drawn to scale.
The dimensions and shape of each duct section are labeled, along with the design CFM (cubic feet per minute) that should flow through each branch. This information is essential for balancing a system after installation and for diagnosing comfort complaints in specific rooms.
Manual D is the ACCA (Air Conditioning Contractors of America) standard for residential duct design, and any duct layout diagram produced for a permitted HVAC installation in the United States should comply with it. The standard governs duct sizing based on equipment CFM, available static pressure, equivalent duct length, and fitting loss coefficients.
When reading a Manual D-compliant duct diagram, the designer's total external static pressure (TESP) budget is the organizing principle: the sum of all pressure losses in the longest duct run must fit within the TESP budget while still delivering adequate CFM to every register. Understanding this constraint helps technicians diagnose systems where a previous installer under-sized the trunk or used too many sharp elbows.
Return air sizing is one of the most chronically under-designed elements in residential HVAC systems, and a careful reading of the duct diagram often reveals the problem. Many older homes have a single return grille in the hallway and a single return duct feeding the air handler — a design that works adequately when interior doors are open but starves the system of return air when bedroom doors are closed.
Modern best-practice diagrams show either a return duct to every room, transfer grilles above doors, or a dedicated jump duct to relieve pressure differentials. When you see a duct diagram with a single small return and multiple supply branches, flag it immediately as a likely source of comfort and efficiency complaints.
Zoning system diagrams add a layer of complexity to the basic duct layout by introducing motorized dampers, a zone control board, and multiple thermostats. Each zone has its own damper actuator, and the zone board coordinates damper position with equipment operation to prevent over-pressurization when only one zone is calling.
A bypass damper — often located near the air handler on the supply side — is frequently included to relieve excess static pressure when all but one zone closes. Reading a zoning diagram requires understanding not just where the ducts go, but how the control board sequences damper opening and closing in response to simultaneous or conflicting thermostat calls.
Commercial HVAC ductwork diagrams add yet another level of detail. Single-duct VAV systems show a main supply air trunk fed by the air handling unit, with VAV terminal units branching off to each zone.
Each VAV box has its own damper, actuator, and DDC (direct digital control) controller, and the diagram shows both the ductwork connections and the control wiring back to the building automation system (BAS). When a zone is too hot or too cold, a technician reads the VAV box diagram to understand whether the problem is at the terminal unit (damper stuck, actuator failed, DDC offline) or upstream in the duct system (insufficient primary air, duct leakage, fan speed issue).
Insulation requirements are noted on commercial duct diagrams in ways that residential drawings often omit. Supply ducts running through unconditioned spaces — attics, crawlspaces, and exterior wall cavities — must be insulated to prevent condensation and heat gain. Diagrams specify the R-value of duct insulation required for each section, and inspectors verify compliance during rough-in.
In humid climates, improperly insulated supply ducts running through hot attics can lose 20–30 percent of the system's cooling capacity before the air ever reaches the conditioned space. This energy loss shows up clearly on an energy audit report but is preventable with proper diagram review before installation.
When preparing for HVAC certification exams, spend at least two or three study sessions working exclusively with duct layout diagrams from real commercial and residential projects. Download sample drawings from ACCA, your state contractor licensing board, or ASHRAE's educational resources. Practice calculating the equivalent duct length of a given run, estimating CFM from a duct cross-section and velocity, and identifying code-required clearances and access panel locations. Technicians who can read ductwork diagrams confidently complete commissioning and troubleshooting work in significantly less time than those who rely solely on trial-and-error airflow measurement.
For a deeper look at this topic, see our guide to hvac system diagram.
Readers who want more detail usually continue with hvac system diagram.
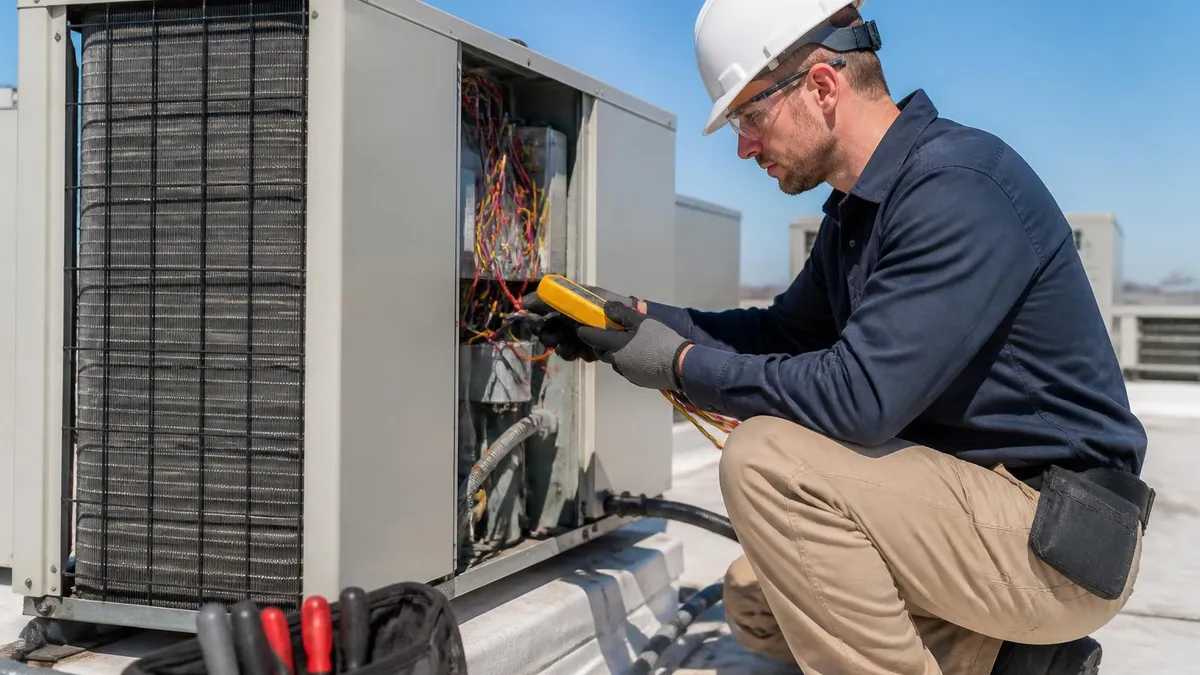
On real job sites, installed ductwork, piping, and wiring frequently deviate from the original design diagram — sometimes intentionally, sometimes due to field conditions, and sometimes due to errors. Always verify critical measurements (duct dimensions, refrigerant line sizes, wire gauges) against the physical installation rather than assuming the diagram is accurate. An as-built diagram, if one exists, is far more reliable than the original design set when diagnosing problems on an existing system.
Using HVAC system diagrams for systematic troubleshooting — rather than relying on intuition or experience alone — is what separates technicians who consistently find the root cause on the first visit from those who replace parts until the problem disappears.
A structured approach begins before you even open the equipment cabinet: pull the wiring diagram for the specific model, identify the complaint, and mentally trace which circuit or subsystem would cause that symptom if it failed. This pre-diagnostic thinking using the diagram saves time and prevents the common mistake of testing components that cannot possibly be the cause of the observed symptom.
For a no-cooling complaint, start by tracing the Y-signal path on the ladder diagram. The Y signal leaves the thermostat, travels to the air handler control board, and then is sent to the outdoor unit where it energizes the compressor contactor coil. If the compressor is not running, follow the Y-signal rung and test each series component: the contactor coil itself, the high-pressure switch, the low-pressure switch, and any time-delay relay.
If the Y signal is present at the contactor coil but the contactor is not pulling in, the contactor has failed. If the Y signal is missing before the high-pressure switch, the switch has tripped or failed open. The diagram tells you exactly what to test and in what order.
Refrigeration system diagrams support a parallel diagnostic process. If pressure readings indicate high suction pressure and low discharge pressure, the diagram helps you identify the components responsible for those conditions: a failed compressor, a failed compressor valve, or a reversing valve stuck in heating mode on a heat pump.
If suction pressure is low and superheat is high, the diagram points to a restriction at or before the evaporator — a clogged filter, a partially closed service valve, or a failing TXV. These pressure-symptom relationships are encoded in the diagram's depiction of the high-side and low-side pressure zones, making the diagram an active diagnostic tool rather than a passive reference document.
Hydronic and boiler system diagrams require the same systematic approach. A hot water heating system diagram shows the boiler, circulator pump, expansion tank, air separator, and zone valves, along with the piping connections between them. If one zone is not heating, the technician traces that zone's piping loop on the diagram: is the zone valve opening?
Is the circulator running? Is there air trapped in the zone loop? Is the boiler producing hot water? Each question maps to a specific component and location shown on the diagram, and the answers can be obtained with a voltmeter, a thermometer, and a pressure gauge — in a logical sequence dictated by the diagram rather than guesswork.
Building automation system (BAS) integration diagrams are becoming essential reading for commercial technicians as more buildings install networked DDC controls. These diagrams show how each field device — sensor, actuator, VAV controller — connects back to a BAS controller, and how BAS controllers communicate with a central server or cloud platform.
When a zone's setpoint is not being maintained, the technician must determine whether the problem is in the mechanical system (equipment not performing), the field device (sensor reading incorrectly), the DDC controller (logic error or failed output), or the BAS network (communication fault). The integration diagram defines which layer the problem lives in and which team — mechanical, controls, or IT — is responsible for the fix.
Commissioning documentation, which includes system diagrams marked up with actual measured values, is one of the most valuable troubleshooting resources on a commercial project. When a system was commissioned correctly and the commissioning report documents actual airflows, temperatures, pressures, and electrical readings at startup, a technician responding to a service call years later has a baseline to compare against.
Deviations from commissioning values — higher static pressure, lower airflow, different refrigerant pressures — point directly to what has changed in the system since it was new. Technicians who keep good service records using marked-up diagrams build this baseline even on jobs that were never formally commissioned.
Finally, remember that the ability to use system diagrams efficiently is itself a professional differentiator that affects career trajectory and earning potential. Technicians who can read and mark up complex diagrams are trusted with more complex service calls, move into lead and supervisory roles faster, and are better positioned for roles in commissioning, controls, and project management. The investment in learning to read every type of HVAC system diagram — refrigeration cycle, wiring schematic, duct layout, piping isometric, and BAS integration — pays compounding dividends throughout an entire career in the trade.
Practical tips for studying HVAC system diagrams effectively begin with sourcing the right materials. Generic textbook diagrams are useful for learning fundamental concepts, but the most productive study material comes from actual manufacturer installation and service manuals. Major manufacturers — Carrier, Trane, Lennox, Daikin, Rheem — publish detailed technical documentation on their websites, often including multiple diagram formats for every product line. Download the service manual for a residential split system, a heat pump, and a commercial rooftop unit, then work through all three sets of diagrams until the symbol conventions become second nature.
Active recall techniques work far better than passive reading when studying diagrams. Instead of tracing lines with your eyes, cover part of the diagram and see if you can describe what should be there. Quiz yourself on what happens to refrigerant pressure and temperature at each labeled point in the cycle.
Practice drawing simple ladder diagrams from memory — the cooling circuit, the heating circuit, and the defrost circuit for a heat pump — and then compare your drawing to the manufacturer's schematic. Each error you catch in your own drawing reveals a gap in understanding that you can immediately target with focused review.
Study groups that work through real service scenarios using actual diagrams build diagnostic speed faster than solo study. One person describes a set of symptoms and instrument readings; the group collectively traces the relevant circuit or subsystem on the diagram to identify the most likely cause.
This collaborative process simulates the mental pressure of a real service call, where the clock is running and a building full of occupants is waiting for cooling or heat. It also surfaces different interpretive approaches and edge cases that solo study rarely generates. Pair this with hands-on lab time whenever possible, since diagram comprehension and physical system experience reinforce each other.
Online resources for HVAC diagram study have expanded significantly in recent years. YouTube channels run by working technicians frequently feature detailed walkthroughs of real service calls that reference actual manufacturer wiring diagrams, including the specific meter readings that confirmed each diagnosis.
These videos are invaluable for seeing how an experienced technician's eyes move across a diagram — what they look for first, what they skip, and how they use the diagram to organize their physical measurements. Supplement video learning with practice exams that include diagram interpretation questions, since exam questions frequently present a partial diagram and ask you to identify the missing component, the failure mode, or the correct measurement point.
Simulation software that models HVAC system behavior — changing refrigerant charge, simulating a stuck TXV, or failing a condenser fan motor — while displaying an animated diagram of the affected system is now available through several HVAC training programs.
These tools make the connection between diagram reading and real-world consequences viscerally clear: when the TXV fails to open, you see suction pressure drop and superheat rise on the diagram in real time, exactly as they would on your gauge manifold. If your training program offers simulation access, prioritize it, since the cognitive connection built through simulation transfers directly to job-site confidence.
Certification exam preparation specifically for diagram-related questions should include reviewing sample questions from the EPA 608 exam, state journeyman exams, and NATE (North American Technician Excellence) certification exams. Each of these credentials tests diagram reading at a different level of detail. EPA 608 focuses on refrigerant handling and recovery, with diagram questions centered on the refrigeration cycle. State journeyman exams often include ladder diagram questions and code-compliance duct layout questions. NATE specialty certifications in air conditioning, heat pumps, and commercial refrigeration include advanced diagnostics questions that require interpreting multi-system diagrams under time pressure.
The technician who invests time in mastering HVAC system diagrams early in their career gains a permanent advantage that compounds over decades. Every new equipment line, every new refrigerant, every new control platform introduces new diagrams — but the foundational reading skills remain constant. The compressor is still a pressure pump, the expansion device still marks the high-low boundary, the ladder diagram still traces logic from power rail to load, and the duct layout still balances airflow against static pressure budget. Master the principles behind the diagrams, and every new diagram you encounter becomes readable within minutes rather than hours.
HVAC Questions and Answers
HVAC Sales: The Complete Guide to Selling Heating and Cooling Systems, Building Customer Trust, and Closing More Deals

HVAC Air Duct Sealing: The Complete Homeowner and Contractor Guide to Sealing Ductwork for Efficiency, Comfort, and Indoor Air Quality
HVAC Solutions: The Complete Guide to Heating, Cooling, and Indoor Air Quality Systems for Homes and Buildings

Commercial HVAC Repair: Systems, Costs, and Service Strategies
HVAC Apprenticeship Programs: Your Complete Guide to Starting a Hands-On Career in Heating, Ventilation, and Air Conditioning
About the Author

NATE Certified HVAC Technician & Licensing Exam Trainer
Universal Technical InstituteMike Johnson is a NATE-certified HVAC technician and EPA 608 universal-certified refrigerant handler with a Bachelor of Science in HVAC/R Technology. He has 19 years of commercial and residential HVAC installation and service experience and specializes in preparing technicians for NATE certification, EPA 608, A2L refrigerant safety, and state HVAC contractor licensing examinations.