
EEG Test Results Explained: How to Read, Interpret, and Understand Your Brain Wave Report
EEG test results explained: 🗨️ normal vs abnormal findings, wait times, costs, side effects, and what your neurologist looks for in the report.
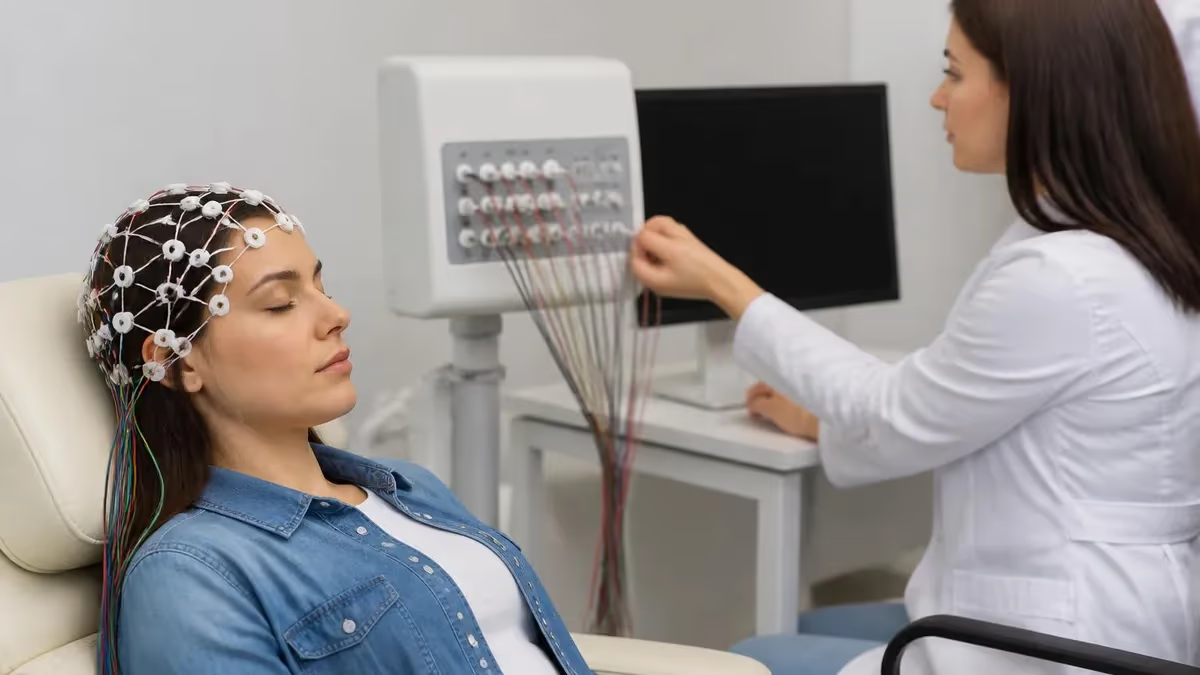
Waiting for eeg test results can feel like the longest few days of your life. You sat through the wires, the flashing lights, the deep breathing, and now you want to know what those wavy lines actually mean. An eeg test records the tiny electrical signals your brain produces every second, and the report your neurologist generates from that recording is a structured summary of what those signals looked like during wakefulness, drowsiness, sleep, and provocation. Understanding the basics of that report makes the follow-up appointment far less intimidating.
The phrase “normal eeg” does not mean your brain is perfect, and an “abnormal eeg” does not automatically mean epilepsy. Results sit on a spectrum: background rhythm, symmetry, reactivity, focal slowing, epileptiform discharges, and response to activation procedures like photic stimulation and hyperventilation. Each of those items is graded by a board-certified neurologist who compares your tracing against age-matched norms, your clinical history, and any medications you take. The final impression is a clinical judgment, not a pure data readout.
For most outpatients, a routine 20- to 40-minute recording is read within 24 to 72 hours, while ambulatory or long-term monitoring studies can take a week or longer because they generate hundreds of hours of data. Hospitals running continuous EEG in an ICU often produce preliminary reads the same shift. Knowing the expected turnaround helps you avoid the spiral of refreshing your patient portal at 11 p.m. on a Saturday hoping a neurologist is reading reports.
Cost and access matter too. A standard outpatient eeg medical test in the United States is billed between roughly $200 and $1,500 depending on facility, sedation, and whether video is added. Insurance typically covers the study when ordered for seizures, syncope, encephalopathy, or unexplained altered mental status. Self-pay patients can often negotiate a flat rate, and freestanding neurology clinics frequently undercut hospital outpatient pricing by 40 to 60 percent.
Side effects are uncommon. The paste used to glue electrodes to your scalp may itch, hyperventilation can trigger lightheadedness, and photic stimulation occasionally provokes a brief seizure in patients with photosensitive epilepsy — which is, in fact, diagnostically useful. The test itself delivers no electricity into you. It only listens. That listening produces a report that, once decoded, becomes a powerful tool for your care team.
This guide walks through every part of an EEG report in plain English. You will learn what background rhythms mean, how spikes and sharp waves differ from artifact, what “focal slowing” suggests, why your neurologist cares about reactivity to eye opening, and how findings translate into next steps like medication, imaging, or repeat monitoring. By the end, the language on your report will read less like a foreign script and more like a clinical conversation you can participate in.
We will also cover practical questions patients actually ask: how long results take, what a normal report looks like, whether a single normal EEG rules out epilepsy, and how follow-up testing decisions get made. Whether you had a routine study, a sleep-deprived recording, or a multi-day ambulatory hookup, the framework here applies.
EEG Test Results by the Numbers

What's Inside an EEG Report
A short paragraph summarizing why the test was ordered: seizures, syncope, confusion, headache, or follow-up. This context shapes how the reader interprets borderline findings.
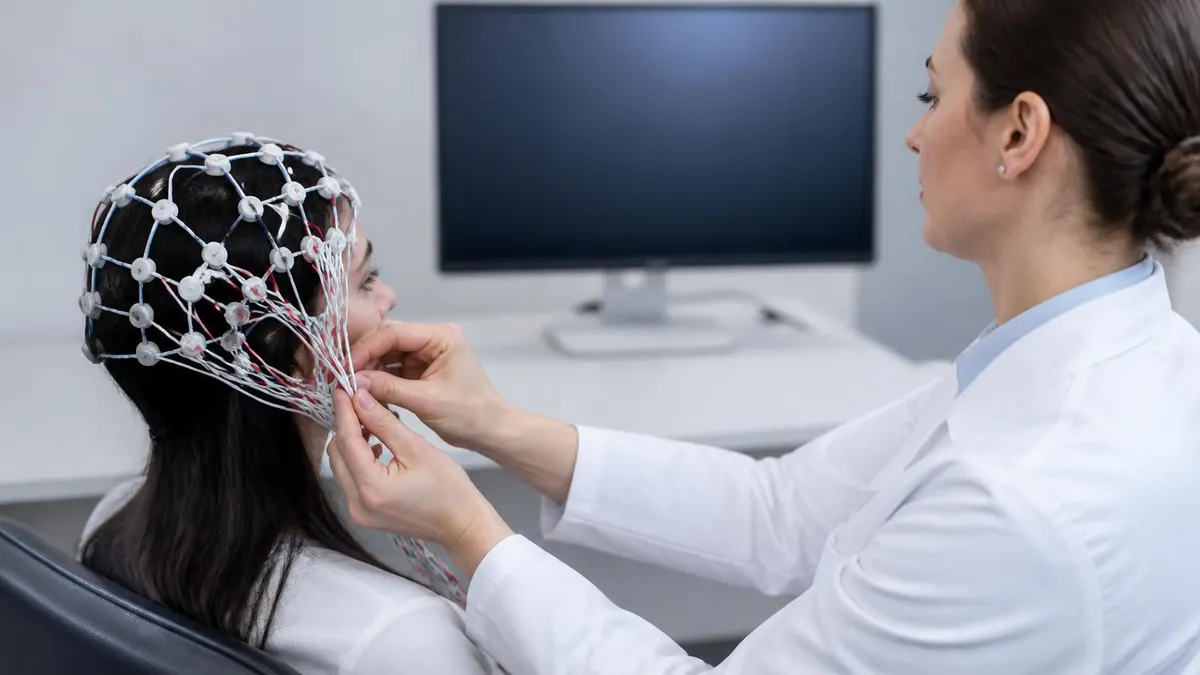
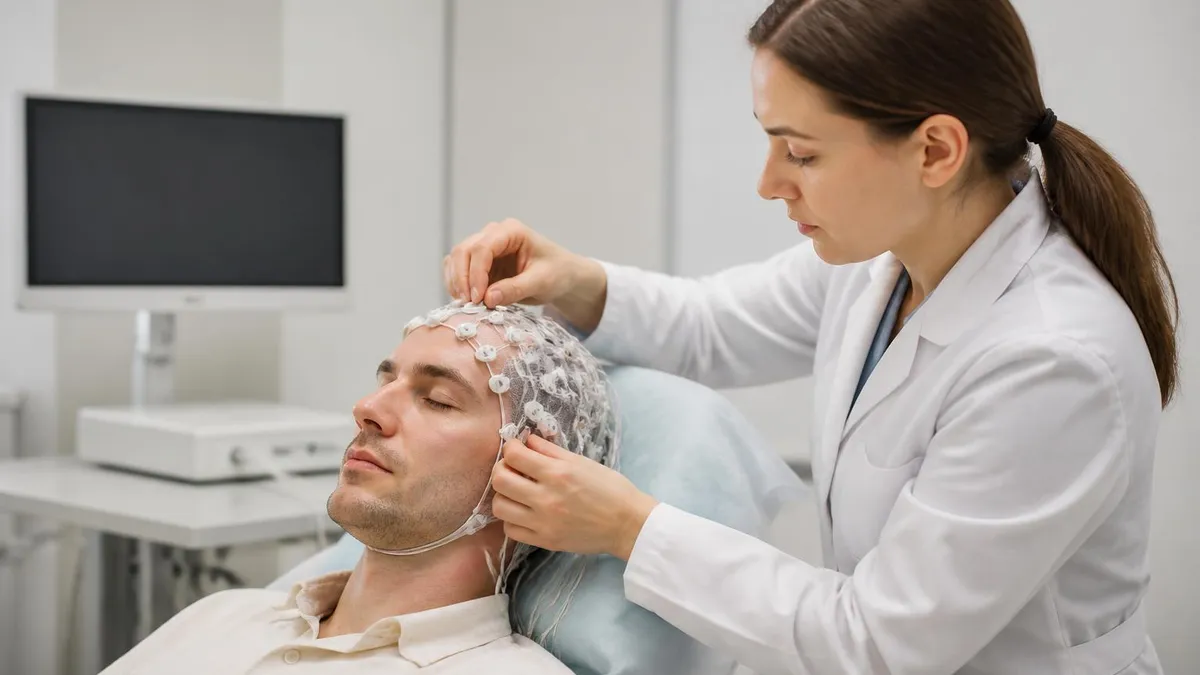
Documents recording conditions: electrode placement (10-20 system), montages used, recording duration, states captured (awake, drowsy, sleep), and activation procedures like hyperventilation and photic stimulation.
Describes the dominant brain rhythms, their frequency, amplitude, symmetry, and reactivity. The posterior dominant alpha rhythm is the single most important normal feature in adults.
Lists any focal slowing, generalized slowing, epileptiform discharges (spikes, sharp waves, spike-and-wave complexes), or electrographic seizures captured during recording.
The neurologist's bottom-line interpretation: normal, abnormal due to specific findings, and what those findings suggest about underlying brain function or seizure risk.
The difference between a normal and abnormal EEG report comes down to whether your brain's electrical activity falls within the expected range for your age, state of arousal, and medication status. A normal adult report typically describes a well-organized posterior dominant rhythm between 8 and 13 Hz that attenuates with eye opening, symmetric activity between the left and right hemispheres, normal sleep architecture if drowsiness or sleep was captured, and no epileptiform discharges or focal slowing during the entire recording or activation procedures.
Abnormal findings fall into broad categories. Generalized slowing — too much theta (4–7 Hz) or delta (under 4 Hz) when you should be awake — suggests diffuse cerebral dysfunction from causes like metabolic encephalopathy, medication effect, dementia, or post-ictal state. Focal slowing in one region points toward a localized problem: stroke, tumor, abscess, contusion, or post-surgical change. The neurologist describes location using lobe and electrode names like “left temporal” or “right frontocentral.”
Epileptiform discharges are the findings most patients worry about. These are sharp, transient waveforms that stand out from background — spikes (under 70 milliseconds), sharp waves (70–200 ms), and spike-and-wave complexes. They suggest cortex that is prone to generating seizures, but a single discharge does not equal a seizure diagnosis. Your neurologist weighs the discharge type, location, frequency, and your clinical history to decide whether the pattern supports epilepsy and what type.
Reactivity matters as much as the resting pattern. A normal alpha rhythm should disappear when you open your eyes — this is called alpha blocking or attenuation. Failure to react can indicate cortical injury. Drowsiness should produce vertex waves, then sleep spindles, K-complexes, and slow-wave sleep in a recognizable progression. Absent or asymmetric sleep features can themselves be abnormal even without spikes.
Activation procedures probe for hidden abnormalities. Hyperventilation for three to five minutes lowers blood CO2 and can unmask absence seizures or focal slowing. Photic stimulation — flashing lights at different frequencies — looks for photoparoxysmal response, a marker of generalized epilepsy. Sleep deprivation before the study increases yield by making it easier to capture drowsy and sleep states where many discharges first appear. If you are curious how the recording itself is visualized, this gallery of what is a eeg test tracings can make the descriptions concrete.
Context turns findings into meaning. A few isolated sharp waves in the temporal region of a 70-year-old with no seizure history may be called “non-specific” or even normal variants. The same pattern in a 25-year-old with two unexplained convulsions strongly supports a diagnosis of focal epilepsy and triggers medication discussions. The same waveform, in other words, can carry vastly different weight depending on who you are and why the test was ordered.
This is why a “normal” EEG never fully rules out epilepsy. A single 30-minute snapshot catches discharges in only about half of people with confirmed seizures. Repeat studies, sleep-deprived EEGs, and ambulatory monitoring substantially raise the yield. Your neurologist will weigh the negative result against clinical suspicion and decide whether further recording is justified.
EEG Practice Test Questions
Prepare for the EEG - Electroencephalography exam with our free practice test modules. Each quiz covers key topics to help you pass on your first try.
EEG Abnormal Epileptiform Patterns
EEG Exam Questions covering Abnormal Epileptiform Patterns. Master EEG Test concepts for certification prep.
EEG Activation Procedures
Free EEG Practice Test featuring Activation Procedures. Improve your EEG Exam score with mock test prep.
EEG Artifact Identification
EEG Test Prep for Artifact Identification. Practice EEG Quiz questions and boost your score.
EEG Electrode Placement and Montages
EEG Questions and Answers on Electrode Placement and Montages. Free EEG practice for exam readiness.
EEG - Electroencephalography Abnormal Epil...
EEG Mock Test covering - Electroencephalography Abnormal Epileptiform Patterns. Online EEG Test practice with instant feedback.
EEG - Electroencephalography Activation Pr...
Free EEG Quiz on - Electroencephalography Activation Procedures. EEG Exam prep questions with detailed explanations.
EEG - Electroencephalography Artifact Iden...
EEG Practice Questions for - Electroencephalography Artifact Identification. Build confidence for your EEG certification exam.
EEG - Electroencephalography Electrode Pla...
EEG Test Online for - Electroencephalography Electrode Placement and Montages. Free practice with instant results and feedback.
EEG - Electroencephalography Instrumentati...
EEG Study Material on - Electroencephalography Instrumentation and Calibration. Prepare effectively with real exam-style questions.
EEG - Electroencephalography Neuroanatomy ...
Free EEG Test covering - Electroencephalography Neuroanatomy and Physiology. Practice and track your EEG exam readiness.
EEG - Electroencephalography Non-Epileptif...
EEG Exam Questions covering - Electroencephalography Non-Epileptiform Abnormalities. Master EEG Test concepts for certification prep.
EEG - Electroencephalography Normal EEG Wa...
Free EEG Practice Test featuring - Electroencephalography Normal EEG Waveforms. Improve your EEG Exam score with mock test prep.
EEG - Electroencephalography Patient Safet...
EEG Mock Exam on - Electroencephalography Patient Safety and Ethics. EEG Study Guide questions to pass on your first try.
EEG - Electroencephalography Pediatric and...
EEG Test Prep for - Electroencephalography Pediatric and Neonatal EEG. Practice EEG Quiz questions and boost your score.
EEG ICU and Continuous EEG Monitoring
EEG Questions and Answers on ICU and Continuous EEG Monitoring. Free EEG practice for exam readiness.
EEG Instrumentation and Calibration
EEG Mock Test covering Instrumentation and Calibration. Online EEG Test practice with instant feedback.
EEG Neuroanatomy and Physiology
Free EEG Quiz on Neuroanatomy and Physiology. EEG Exam prep questions with detailed explanations.
EEG Non-Epileptiform Abnormalities
EEG Practice Questions for Non-Epileptiform Abnormalities. Build confidence for your EEG certification exam.
EEG Normal EEG Waveforms
EEG Test Online for Normal EEG Waveforms. Free practice with instant results and feedback.
EEG Patient Safety and Ethics
EEG Study Material on Patient Safety and Ethics. Prepare effectively with real exam-style questions.
How Long Is an EEG Test and When Do Results Arrive?
A routine outpatient EEG records for 20 to 40 minutes of clean data, plus 10 to 15 minutes of setup. Total chair time runs 60 to 90 minutes when you include electrode placement, impedance checks, and activation procedures like hyperventilation and photic stimulation. Most patients leave within two hours.
Reports usually appear in your medical chart within 24 to 72 hours. Larger academic centers may turn results around the same day, while small community hospitals sometimes take up to a week if a neurologist reads only on specific days. Urgent inpatient studies are read within hours by on-call epileptologists.

Advantages and Limitations of EEG Testing
- +Non-invasive — no needles, no radiation, no contrast injection
- +Excellent temporal resolution — captures brain activity millisecond by millisecond
- +Relatively inexpensive compared to MRI, PET, or invasive monitoring
- +Can be repeated as often as clinically needed with no cumulative risk
- +Detects epileptiform activity that imaging studies cannot see
- +Performed in clinics, hospitals, and at home with portable systems
- +Provides functional information that complements structural imaging
- −Poor spatial resolution — cannot localize deep brain structures precisely
- −A single normal EEG does not rule out epilepsy
- −Vulnerable to artifact from muscle, movement, eye blinks, and sweating
- −Requires patient cooperation for activation procedures
- −Electrode paste can be uncomfortable and difficult to wash out
- −Sedation may be needed for young children or agitated patients
- −Interpretation requires specialized training and is subject to inter-reader variability
Questions to Ask About Your EEG Test Results
- ✓Was my background rhythm normal for my age and state?
- ✓Were both hemispheres symmetric throughout the recording?
- ✓Did you capture drowsiness and sleep, or only wakefulness?
- ✓Were any epileptiform discharges seen, and where were they located?
- ✓Did hyperventilation or photic stimulation provoke any abnormality?
- ✓Are the findings specific to a diagnosis, or non-specific?
- ✓Does this result change my current medications or treatment plan?
- ✓Do I need a repeat EEG, ambulatory EEG, or video-EEG monitoring?
- ✓Should I get an MRI to look for a structural cause?
- ✓Are there activities — driving, swimming, heights — I should avoid until follow-up?
A Normal EEG Does Not Rule Out Epilepsy
A single routine EEG captures epileptiform activity in only 30 to 50 percent of people with confirmed epilepsy. Sleep-deprived studies push that yield to 80 percent, and 72-hour ambulatory recordings push it higher still. If your clinical story strongly suggests seizures, your neurologist may pursue further testing even after a normal report.
Several abnormal patterns appear often enough in EEG reports that knowing them by name helps you follow the conversation. Focal slowing — most commonly described as “intermittent left temporal theta” or similar — reflects localized cerebral dysfunction. The list of causes is long: prior stroke, tumor, post-traumatic scar, encephalitis, abscess, or even a region of cortical dysplasia. The location of the slowing roughly maps to the underlying lesion, which is why neurologists frequently pair an abnormal EEG with an MRI to find the structural correlate.
Generalized slowing means the entire brain is running slower than it should. It is the hallmark of diffuse encephalopathy from metabolic causes (low sodium, high ammonia, uremia, hypoglycemia, hypothyroidism), toxins and drugs (benzodiazepines, opioids, alcohol withdrawal), infections (meningitis, sepsis), and degenerative conditions like Alzheimer disease. Grading is qualitative: mild, moderate, or severe. Severe generalized slowing in an ICU patient signals a sick brain that needs urgent attention.
Epileptiform discharges include spikes, sharp waves, polyspikes, and spike-and-wave complexes. Generalized 3-Hz spike-and-wave is the signature of childhood absence epilepsy. Generalized polyspike-and-wave suggests juvenile myoclonic epilepsy. Focal spikes in the centrotemporal region are typical of benign rolandic epilepsy. Temporal sharp waves frequently appear in mesial temporal lobe epilepsy, often after febrile seizures in childhood. Each of these patterns tells a story about syndrome type, prognosis, and medication choice.
Periodic patterns deserve special mention because they appear most often in critically ill patients. Generalized periodic discharges (GPDs), lateralized periodic discharges (LPDs), and bilateral independent periodic discharges (BIPDs) sit on a continuum between encephalopathy and ongoing seizure activity. They are common after cardiac arrest, in herpes encephalitis, and in advanced dementia. The clinical question is always: is this pattern injuring the brain, and does it need treatment with anti-seizure medication?
Normal variants also fill EEG reports and can be mistaken for pathology if you are not careful. Wicket spikes, benign epileptiform transients of sleep (BETS), 14-and-6 positive spikes, and rhythmic mid-temporal theta of drowsiness all look striking but carry no clinical significance. A skilled reader recognizes them instantly and labels them as normal, sparing patients unnecessary worry and unneeded medication. If your report mentions a normal variant, that is reassuring news, not a hidden diagnosis.
Electrographic seizures are the highest-stakes finding. These are sustained, evolving rhythmic discharges that meet formal criteria for seizure activity on EEG. They may occur with obvious clinical convulsions, with subtle signs like staring or automatisms, or — most dangerously — with no visible signs at all (non-convulsive status epilepticus). Capturing one on a recording is diagnostic and almost always triggers immediate treatment changes.
The numerical metrics in your report — frequency in Hz, amplitude in microvolts, duration in seconds — give the neurologist precision but rarely matter to patients directly. What matters is the impression line that translates those numbers into clinical meaning, and the recommendations that follow.

If your report mentions electrographic seizures, status epilepticus, periodic discharges, or severe diffuse slowing — and you have not already been contacted — call your neurologist's office promptly. These findings often warrant medication changes, additional imaging, or hospital evaluation within 24 to 48 hours, not at a routine follow-up weeks away.
What happens after your EEG report depends entirely on what it says and why it was ordered. If results are normal and clinical suspicion was low, the workup often ends there and you return to your referring physician with reassurance. If results are normal but suspicion remains high — for example, after a witnessed convulsion with biting and incontinence — your neurologist may order a sleep-deprived study, an ambulatory EEG, or a brain MRI to look for a structural cause that the EEG missed.
If the report shows focal epileptiform discharges or focal slowing, expect an MRI of the brain with epilepsy protocol cuts through the hippocampus and temporal lobes. The combination of localized EEG abnormality and an MRI finding (mesial temporal sclerosis, cortical dysplasia, low-grade tumor) often clinches a diagnosis and opens the door to surgical evaluation if seizures persist despite medication.
Generalized epileptiform patterns usually lead to a discussion about generalized epilepsy syndromes and broad-spectrum anti-seizure medications like valproate, lamotrigine, or levetiracetam. The choice depends on age, sex, comorbidities, and side-effect profile. Women of childbearing age receive special counseling because some medications carry teratogenic risk.
If your report describes encephalopathy, the focus shifts to finding and reversing the cause: correcting electrolytes, stopping offending medications, treating infection, managing liver or kidney failure, or working up dementia. A follow-up EEG weeks or months later often shows improvement once the underlying problem is addressed, and that improvement itself becomes useful confirmation.
Costs of follow-up vary widely. An MRI brain runs $400 to $3,000 self-pay; a sleep-deprived EEG roughly matches the routine eeg test price; ambulatory EEG ranges $1,500 to $4,000; inpatient video-EEG monitoring can exceed $15,000 for a five-day admission. Insurance generally covers these when medically justified, but prior authorization and in-network referrals matter — confirm before scheduling.
Driving restrictions are one of the most immediate practical consequences of an abnormal EEG when paired with a seizure. State laws vary, with seizure-free periods ranging from three to twelve months before driving privileges resume. Your neurologist is legally and ethically required to discuss this, and in some states must report to the DMV. Plan for transportation while restrictions are in place.
Finally, EEG is not a one-and-done test. People with epilepsy often have multiple recordings over a lifetime — at diagnosis, at medication changes, before considering withdrawal of therapy, and if seizures recur. Each recording adds data, and patterns evolve. The report you hold today is one chapter in a longer story, not a final verdict.
Practical preparation makes EEG results more reliable and easier to act on. Wash your hair the night before with regular shampoo only — no conditioner, no gel, no oils. Residue makes electrodes slip and adds artifact that can obscure real findings. Eat normally; low blood sugar can itself slow the EEG and confuse interpretation. Take your usual medications unless your neurologist specifically asks you to hold an anti-seizure drug for diagnostic reasons.
Bring a written list of every medication, supplement, and recreational substance you take, including doses and timing. Many drugs change the EEG: benzodiazepines add beta activity, lithium can cause slowing, stimulants alter background, alcohol withdrawal produces dramatic changes. The reader interprets your tracing in the context of these substances. Withholding the information leads to misinterpretation, not the other way around.
If a sleep-deprived study is ordered, plan logistics carefully. Stay up until at least 3 a.m. (or all night for stricter protocols), arrange a driver, bring snacks and entertainment for the wait, and avoid caffeine for at least eight hours before the recording. Caffeine masks drowsiness, which defeats the entire point of the deprivation. The few hours of discomfort dramatically improve the diagnostic yield.
For ambulatory studies, prepare for limited bathing. Most setups allow sponge baths only — no showers, no swimming, no hair washing for the entire monitoring period. Wear loose, button-front shirts so you can change clothes without disturbing the wires running to your recorder. Keep the event button accessible and use it generously; under-reported events are the most common reason ambulatory studies fail to reach a diagnosis.
Once you receive the report, read it slowly and write down questions before your follow-up. Look up unfamiliar terms — but stop short of self-diagnosing from internet sources. The same waveform means different things in different patients, and only your clinician can integrate the report with your history. Bring a family member if events were witnessed; their description often matters as much as the tracing itself.
Keep copies of every EEG report and, if possible, the raw recording on disc or USB. Future neurologists, especially epileptologists at referral centers, often want to re-read prior studies rather than rely on summary text. Many centers will provide the digital file for a small administrative fee. Storing your own copies prevents delays years later when records have been archived or destroyed.
Finally, give yourself grace through the waiting period. The few days between recording and report are anxious for almost everyone. Talk to people you trust, maintain your routines, and avoid the trap of refreshing your patient portal hourly. When the report arrives, you will be better prepared — informed, equipped with questions, and ready to be a partner in the next steps of your care. For job-seekers curious about who runs these tests, the field of how long is an eeg test technologists is growing steadily and worth exploring.
EEG Questions and Answers
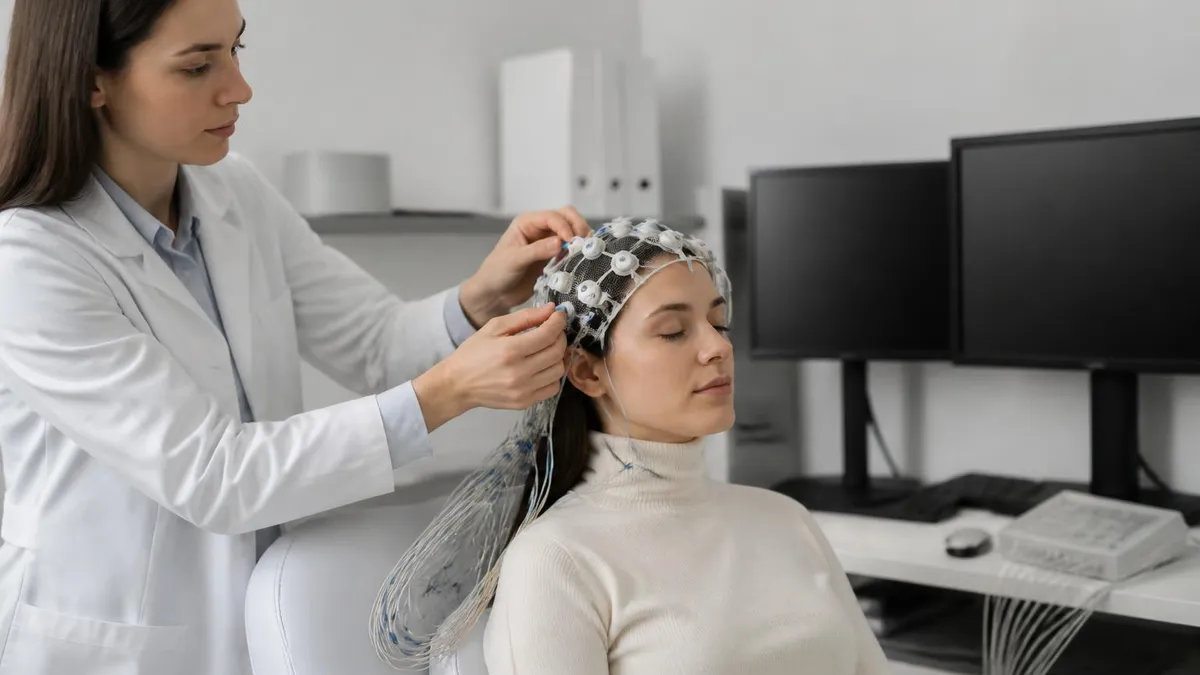
EEG for Seizures: How the Test Diagnoses Epilepsy and What to Expect
EEG Tech Salary 2026: Pay by State, Experience, and Certification
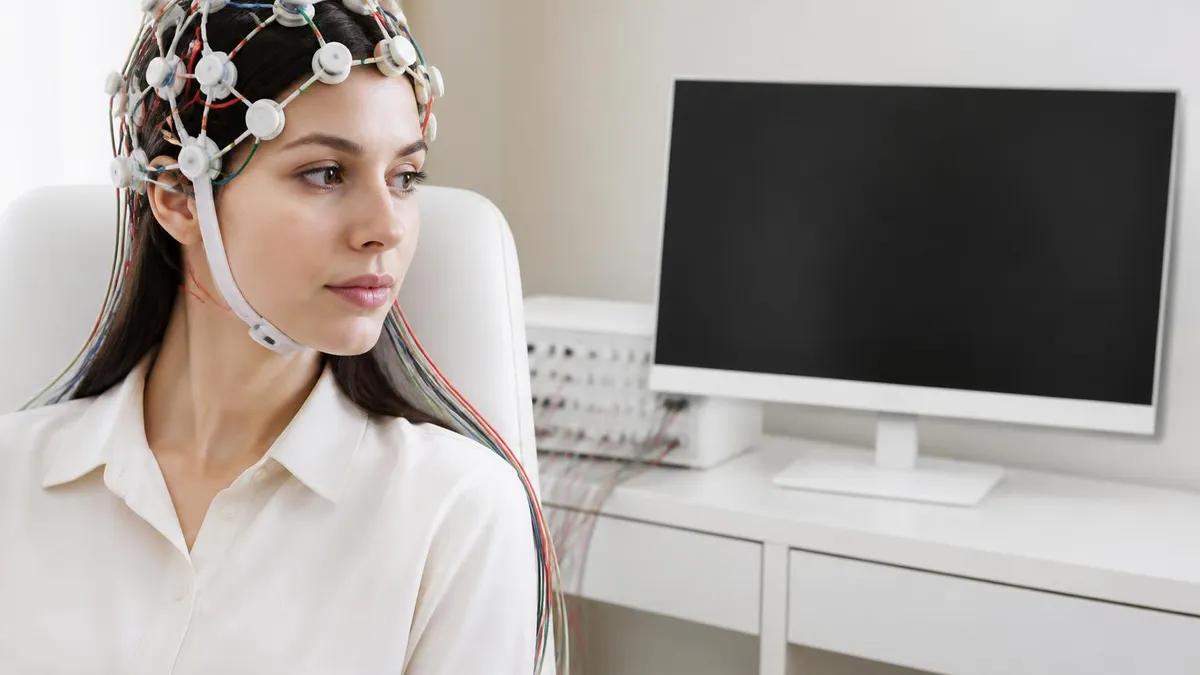
EEG Images: A Visual Guide to Brain Wave Patterns, Recordings, and Test Results
EEG Tech Jobs in 2026: Career Paths, Salaries, and How to Get Hired
Reading EEG Patterns: A Practical Reference for Techs and Trainees
About the Author

Educational Psychologist & Academic Test Preparation Expert
Columbia University Teachers CollegeDr. Lisa Patel holds a Doctorate in Education from Columbia University Teachers College and has spent 17 years researching standardized test design and academic assessment. She has developed preparation programs for SAT, ACT, GRE, LSAT, UCAT, and numerous professional licensing exams, helping students of all backgrounds achieve their target scores.