
Diffusion Imaging in MRI: How DWI and DTI Reveal the Microstructure of Tissue
Diffusion imaging in MRI explained: ✏️ DWI, DTI, ADC maps, b-values, tractography, stroke and tumor protocols, artifacts, and clinical applications.
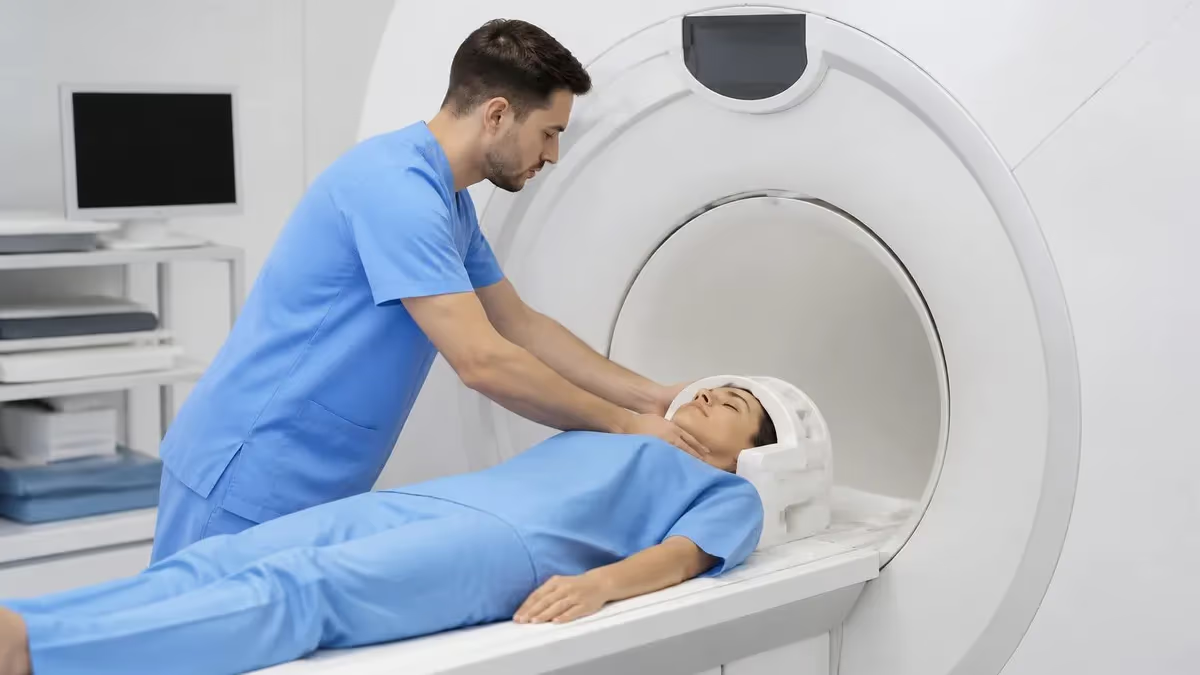
Diffusion imaging in MRI is one of the most powerful tools in modern neuroradiology because it does something no other sequence can do: it measures the random thermal motion of water molecules inside living tissue. By making images sensitive to that microscopic Brownian motion, radiologists can infer the integrity of cell membranes, the density of cellular packing, and the orientation of fiber tracts long before conventional T1 or T2 sequences show any abnormality. Diffusion-weighted imaging (DWI) and diffusion tensor imaging (DTI) have therefore become indispensable in stroke, oncology, neurodegenerative disease, and pre-surgical planning.
The clinical breakthrough came in the mid-1990s when DWI proved able to identify acute ischemic stroke within minutes of symptom onset, hours before any change appears on CT or T2. That single application transformed emergency neuroimaging worldwide and made diffusion sequences a default part of nearly every brain MRI protocol performed today. Outside the brain, diffusion has expanded rapidly into prostate, breast, liver, and whole-body oncologic imaging where mri brain findings correlates strongly with high cellularity.
The physics behind the technique relies on a pair of strong, equal-and-opposite motion-probing gradients placed around a 180-degree refocusing pulse, often called the Stejskal-Tanner scheme. Stationary water molecules are perfectly rephased and contribute full signal, but water that has moved between the two gradient lobes acquires a residual phase shift, dephases, and loses signal. The degree of motion sensitivity is controlled by the b-value, expressed in seconds per square millimeter, with higher b-values producing stronger diffusion weighting and lower overall signal.
From the raw DWI images, software automatically calculates an apparent diffusion coefficient (ADC) map by fitting signal decay across two or more b-values. The ADC map is essential because plain DWI is contaminated by underlying T2 signal — the so-called T2 shine-through effect — and only the ADC map reliably distinguishes true restricted diffusion from bright T2 backgrounds. Low ADC means restricted motion; high ADC means free motion. If you want to understand the broader evolution of these techniques, see The History of MRI: From Discovery to Modern Medicine for the foundational discoveries that made diffusion possible.
Diffusion tensor imaging extends DWI by sampling diffusion in at least six non-collinear directions, allowing the construction of a 3x3 tensor at every voxel. From that tensor we derive fractional anisotropy (FA), mean diffusivity (MD), and the principal eigenvector that points along the dominant fiber direction. Color-coded FA maps — red for left-right, green for anterior-posterior, blue for superior-inferior — and deterministic or probabilistic tractography reveal white-matter pathways such as the corticospinal tract, arcuate fasciculus, and optic radiations in vivo.
More advanced variants now in routine or research use include diffusion kurtosis imaging (DKI), neurite orientation dispersion and density imaging (NODDI), intravoxel incoherent motion (IVIM), and high b-value diffusion (b=2000-3000 for prostate, up to b=10000 in research). Each variant trades acquisition time for additional microstructural detail, and the trend in clinical practice is toward multi-shell, multi-b-value protocols that can be post-processed into several biomarkers from a single scan.
This guide walks through the physics, the protocols, the artifacts, the clinical applications, and the practical interpretation pearls every technologist, resident, and physicist should master. Whether you are preparing for an ARRT MRI registry exam, optimizing a stroke protocol, or simply trying to understand why one lesion is bright on DWI and dark on ADC, the next sections will give you the framework to read diffusion confidently and recognize its pitfalls.
Diffusion Imaging by the Numbers
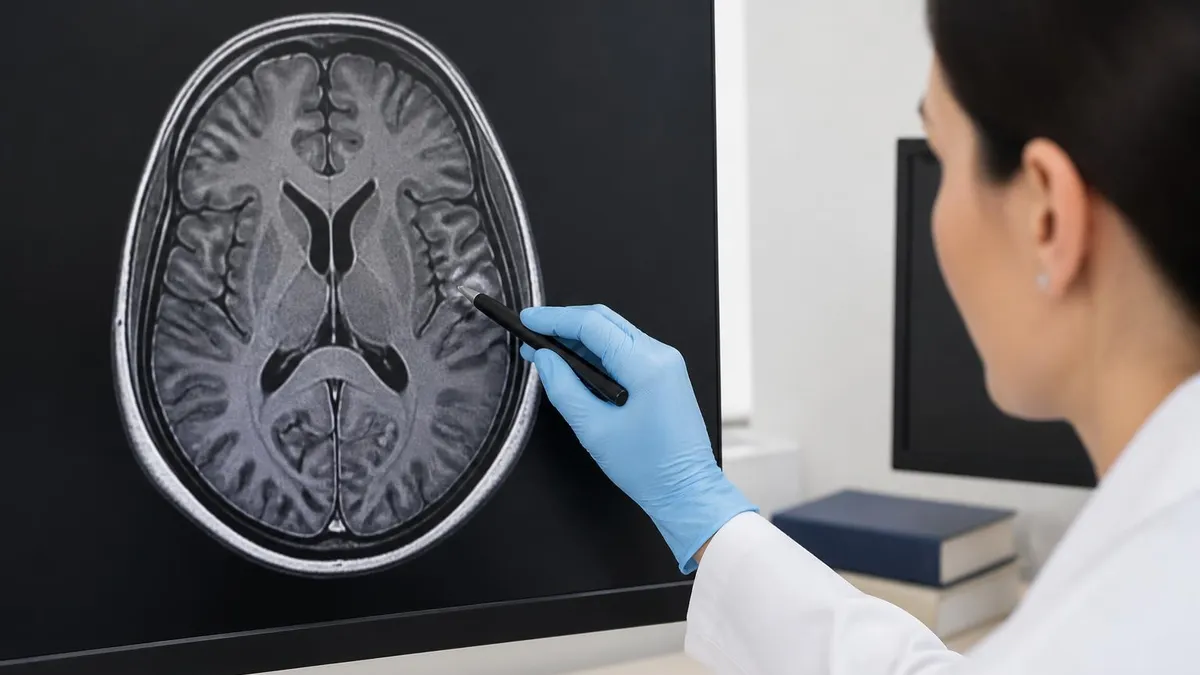
How a Diffusion-Weighted Pulse Sequence Works
90° Excitation Pulse
First Diffusion Gradient
180° Refocusing Pulse
Second Diffusion Gradient
Echo Planar Readout
ADC Map Calculation
The b-value is the single most important parameter the operator controls in diffusion imaging. Mathematically it is defined as b = γ²G²δ²(Δ − δ/3), where γ is the gyromagnetic ratio, G is gradient amplitude, δ is gradient duration, and Δ is the time between the two diffusion lobes. In practice the scanner exposes only the b-value in s/mm², and the system automatically chooses the underlying timings. Higher b-values mean stronger motion sensitivity and lower signal-to-noise, so picking the right value is a clinical decision that depends on the anatomy and pathology being interrogated.
For routine brain imaging, b=0 and b=1000 s/mm² is the workhorse pair, providing excellent stroke sensitivity and good SNR at 1.5T and 3T. For tumor characterization or detection of subtle restriction, many centers add a b=2000 s/mm² acquisition because high-b-value DWI suppresses background T2 signal more aggressively and improves lesion conspicuity. Prostate imaging follows PI-RADS guidance and uses calculated b-values of 1400-2000 s/mm² to differentiate clinically significant cancer from benign tissue, with even higher computed b-values sometimes synthesized from lower acquired values.
The apparent diffusion coefficient is calculated from the Stejskal-Tanner equation S(b) = S(0) × e^(-b·ADC). With two b-values, ADC = ln(S0/Sb)/b. With three or more b-values, a least-squares log-linear fit is performed. ADC values are reported in units of 10⁻³ mm²/s. Free water at body temperature has an ADC of approximately 3.0; normal gray matter sits around 0.7-0.9; white matter ranges 0.6-0.8; acute infarct drops to 0.3-0.5; high-grade tumor often falls to 0.5-0.7; abscess pus may register as low as 0.6-0.9.
Reading diffusion images requires looking at the DWI and the ADC map together. True restricted diffusion is bright on DWI and dark on ADC. T2 shine-through is bright on DWI but bright or normal on ADC — a common pitfall in vasogenic edema, cystic lesions, and chronic infarcts. T2 black-out (rare) is dark on DWI and dark on ADC, sometimes seen in hemorrhage. Reviewing these in tandem is non-negotiable; relying on DWI alone produces false positives. For background on related contrast techniques, see MRI With and Without Contrast: How It Works, What to Expect.
Exponential diffusion-weighted imaging (eDWI) and computed high-b-value images are increasingly automated. eDWI divides the b=high image by the b=0 image to remove T2 weighting and produce a quasi-pure diffusion image. Computed DWI synthesizes images at b-values higher than those actually acquired, saving scan time while improving lesion-to-background contrast — particularly useful in oncologic body imaging where SNR penalties at very high b-values are severe.
Reproducibility of ADC values across scanners remains a practical concern. ADC depends not only on tissue properties but also on b-value selection, gradient hardware, diffusion time, and motion correction. Quantitative comparison across vendors or across longitudinal studies on different magnets should be interpreted with caution, and many modern oncology protocols include phantom QA to track scanner drift. ADC histograms, percentiles, and texture features are increasingly used in research instead of single mean values.
One useful mental anchor: every doubling of b-value roughly halves the SNR, so doubling from 1000 to 2000 means you need either more averages, thicker slices, or accept noisier images. Knowing this tradeoff helps technologists and radiologists negotiate intelligently when a scan must be shortened or when motion is degrading image quality, rather than blindly pushing b-values up because the literature suggests it.
MRI Practice Test Questions
Prepare for the MRI - Magnetic Resonance Imaging exam with our free practice test modules. Each quiz covers key topics to help you pass on your first try.
MRI Knowledge
MRI Exam Questions covering Knowledge. Master MRI Test concepts for certification prep.
MRI Physics
Free MRI Practice Test featuring Physics. Improve your MRI Exam score with mock test prep.
MRI Anatomy and Pathology
MRI Test Prep for MRI Anatomy and Pathology. Practice MRI Quiz questions and boost your score.
MRI Anatomy and Positioning
MRI Questions and Answers on MRI Anatomy and Positioning. Free MRI practice for exam readiness.
MRI Contrast Agents
Free MRI Quiz on MRI Contrast Agents. MRI Exam prep questions with detailed explanations.
MRI Patient Care and Positioning
MRI Practice Questions for MRI Patient Care and Positioning. Build confidence for your MRI certification exam.
DWI vs DTI vs Advanced Diffusion Techniques
Diffusion-weighted imaging is the simplest form of diffusion MRI. It typically acquires images at b=0 and one or two non-zero b-values along three orthogonal directions, then averages them into an isotropic trace image. The output is a DWI image (with residual T2) and a calculated ADC map. DWI is fast, strong, and the standard of care for acute stroke evaluation, abscess characterization, cholesteatoma detection, and oncologic lesion conspicuity throughout the body.
Because DWI uses only three or fewer directions, it cannot describe directional anisotropy and provides only a scalar diffusion measurement per voxel. That limitation is acceptable in most pathology because clinicians mainly want a yes-or-no answer about restriction. Modern scanners complete a brain DWI sequence in 30-90 seconds at 1.5T or 3T, making it one of the highest-yield-per-second sequences in all of imaging.
Strengths and Limitations of Diffusion MRI
- +Detects acute ischemic stroke within minutes of onset, far earlier than CT or conventional MRI
- +Requires no intravenous contrast, making it safe for renal-impaired and pregnant patients
- +Provides quantitative ADC values that can be tracked over time and across visits
- +Highly sensitive to high-cellularity tumors, abscesses, and cytotoxic edema
- +DTI tractography enables non-invasive visualization of white-matter pathways in vivo
- +Fast acquisition — a brain DWI completes in under two minutes on most modern scanners
- −Echo-planar readouts are vulnerable to susceptibility distortion near air-bone-tissue interfaces
- −Low spatial resolution compared to T1 and T2 anatomic sequences, limiting fine structural detail
- −T2 shine-through can mimic restricted diffusion if ADC maps are not reviewed
- −Quantitative ADC values vary across vendors, field strengths, and protocols, limiting comparison
- −Patient motion produces severe artifacts because each direction is acquired separately
- −Advanced techniques like DKI and NODDI require long acquisitions and specialist post-processing
Pros and Cons at a Glance
| Pros | Cons |
|---|---|
| Detects acute ischemic stroke within minutes of onset, far earlier than CT or conventional MRI | Echo-planar readouts are vulnerable to susceptibility distortion near air-bone-tissue interfaces |
| Requires no intravenous contrast, making it safe for renal-impaired and pregnant patients | Quantitative ADC values vary across vendors, field strengths, and protocols, limiting comparison |
| Provides quantitative ADC values that can be tracked over time and across visits | Patient motion produces severe artifacts because each direction is acquired separately |
| Highly sensitive to high-cellularity tumors, abscesses, and cytotoxic edema | Advanced techniques like DKI and NODDI require long acquisitions and specialist post-processing |
Diffusion MRI Protocol Optimization Checklist
- ✓Confirm patient gradient safety — no peripheral nerve stimulation contraindications and verify slew-rate settings
- ✓Choose appropriate b-values for the indication: 0/1000 for brain stroke, 0/800/2000 for prostate, 0/600 for liver
- ✓Use at least three diffusion directions for DWI and six or more for DTI to produce a valid tensor
- ✓Enable parallel imaging (SENSE/GRAPPA/ARC) to reduce EPI distortion and shorten echo train length
- ✓Set slice thickness 4-5 mm for brain DWI, thinner for body work, balanced against SNR
- ✓Center the FOV carefully and align with the magnet isocenter to minimize off-resonance distortion
- ✓Apply fat suppression — typically SPAIR or SPIR — to prevent chemical-shift artifact in EPI
- ✓Review the ADC map alongside DWI on every case to exclude T2 shine-through before calling restriction
- ✓Acquire a B0 fieldmap or reverse-phase-encoded pair if distortion correction is part of the protocol
- ✓Document b-value, number of directions, and gradient mode on the technologist worksheet for QA review
Always read DWI and ADC side-by-side
True restricted diffusion is bright on DWI and dark on ADC. If a lesion is bright on DWI but also bright on ADC, you are seeing T2 shine-through — not restriction. Never call acute infarct, abscess, or cellular tumor from the DWI image alone; the ADC map is the arbiter, and reviewing them together prevents the single most common diffusion interpretation error.
Clinical applications of diffusion imaging now reach far beyond its original neurologic use case. In the brain, DWI remains the gold standard for acute ischemic stroke. Cytotoxic edema from failed sodium-potassium ATPase pumps causes intracellular water accumulation, restricted extracellular space, and dramatically reduced ADC within minutes. The DWI bright, ADC dark signature appears 5-10 minutes after onset and persists for 7-10 days before ADC pseudonormalization. This window allows neurologists to confirm acute stroke and triage patients for thrombolysis or thrombectomy with confidence.
Beyond stroke, brain DWI distinguishes pyogenic abscess (markedly restricted central pus) from necrotic tumor (peripheral restriction only), differentiates epidermoid (restricted) from arachnoid cyst (non-restricted), and identifies cholesteatoma in the temporal bone with non-EPI DWI techniques such as HASTE-DWI or PROPELLER-DWI that resist susceptibility artifact near the skull base. DTI is routinely used in pre-surgical mapping to identify the corticospinal tract relative to a tumor and to predict post-operative motor outcomes.
In oncology, whole-body DWI with background body signal suppression (DWIBS) has become an important tool for lymphoma staging, multiple myeloma surveillance, and metastatic disease screening — particularly in pediatric and pregnant patients where ionizing radiation must be avoided. PET-MRI scanners pair DWIBS with FDG-PET for complementary anatomic and metabolic information. ADC values often correlate inversely with cellularity and Ki-67 proliferation indices, providing a non-invasive surrogate of tumor aggressiveness.
Prostate MRI follows the PI-RADS v2.1 framework, where DWI is the dominant sequence for the peripheral zone. A focal mass with markedly low ADC and high signal on high-b-value DWI scores PI-RADS 4 or 5 and triggers targeted biopsy. Computed b=2000 images are now standard, and ADC thresholds below 0.8 × 10⁻³ mm²/s are highly suggestive of clinically significant cancer. Diffusion has effectively replaced contrast for primary prostate detection in many centers.
Breast DWI is used as a non-contrast complement to dynamic contrast-enhanced MRI and shows promise for screening high-risk women without gadolinium. Liver DWI helps distinguish hemangioma and cysts from solid lesions, characterizes hepatocellular carcinoma, and detects small metastases that conventional sequences miss. Pancreatic and renal DWI add value in lesion characterization, though motion and susceptibility from bowel gas remain challenging.
Musculoskeletal applications include vertebral marrow lesion characterization — benign osteoporotic compression fractures show high ADC while metastatic compression fractures show low ADC — and assessment of soft-tissue tumor cellularity. Cardiac diffusion tensor imaging is an emerging research area that maps myocardial fiber architecture, with potential to assess remodeling after infarction and in cardiomyopathies, though clinical translation requires breath-hold or cardiac-gated EPI sequences that remain technically demanding.
Pediatric applications deserve particular attention. Neonatal hypoxic-ischemic encephalopathy, metabolic encephalopathies, and inherited leukodystrophies all benefit from DWI and DTI. ADC values change rapidly with brain maturation — neonatal white matter has much higher ADC than adult white matter because of high water content and incomplete myelination — so pediatric reference values must be used. Tractography is increasingly applied to congenital malformations and pediatric epilepsy surgical planning. To better understand abbreviations used throughout these reports, see MRI Medical Abbreviation: What MRI Stands For and Why It Matters.
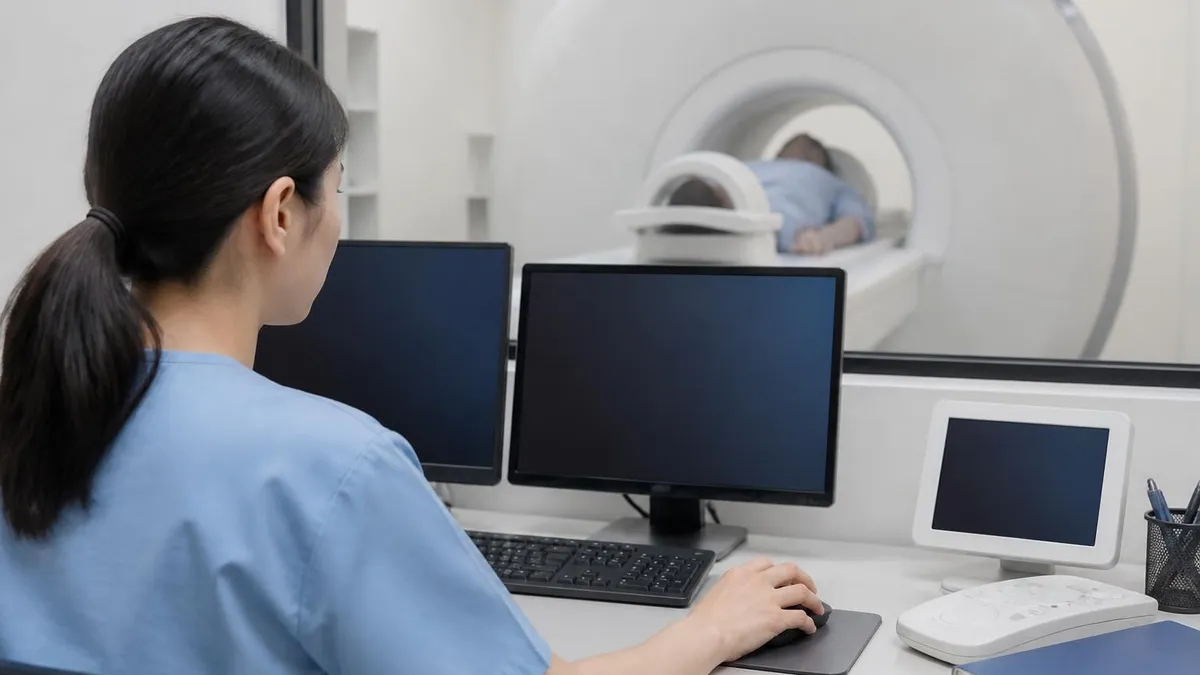
Two pitfalls cause the majority of diffusion misreads. T2 shine-through makes high-T2 lesions look bright on DWI without true restriction — always verify with the ADC map. Susceptibility distortion near the skull base, sinuses, and posterior fossa warps EPI images and can both hide small infarcts and mimic restriction. Use non-EPI DWI or distortion correction when these regions are clinically critical.
Artifacts are the price diffusion pays for its sensitivity. The single-shot echo-planar readout that makes DWI fast also makes it vulnerable to a family of characteristic problems. Susceptibility distortion arises at air-tissue interfaces because off-resonance protons accumulate phase errors during the long EPI readout, stretching or compressing the image along the phase-encode direction. The skull base, frontal sinuses, mastoid air cells, and surgical clips are predictable trouble spots. Reverse-phase-encoded acquisitions and field-mapping techniques like TOPUP can correct most distortion, and modern scanners offer this as a one-button option.
Eddy currents from the strong diffusion gradients induce residual magnetic fields that linger after the gradients switch off. They cause image shifts, shears, and scaling differences between directions, degrading ADC accuracy and producing misregistration in tractography. Vendor-supplied eddy-current correction software realigns each direction before tensor fitting and is essential for high-quality DTI. Twice-refocused spin-echo diffusion sequences also reduce eddy-current effects by cancelling them through balanced gradient pairs.
Nyquist N/2 ghosts arise from inconsistent k-space line sampling between odd and even echoes in EPI. They appear as faint ghost images shifted half the FOV in the phase-encode direction. Calibration scans and phase-correction algorithms typically eliminate them, but a sudden increase in ghosting often signals gradient hardware instability or an aging scanner that needs preventive maintenance.
Motion is uniquely damaging in diffusion because the sequence is gradient-sensitive by design. Bulk patient motion between directions causes signal dropout, misregistration, and biologically meaningless tensors. Cardiac and respiratory pulsation also corrupt the cerebellum, brainstem, and spinal cord. Mitigations include head fixation, child-friendly mock scanners, real-time motion-tracking sequences, and outlier rejection in post-processing. For the spinal cord, ECG-gated diffusion or zoomed FOV techniques like ZOOMit help.
Cross-talk and slice-to-slice intensity variation can appear when slices are too closely packed for the chosen TR, and chemical-shift artifact from inadequate fat suppression can produce ghosts of subcutaneous fat across the FOV. SPAIR is preferred at 3T because of better B1 homogeneity, while STIR is used when high uniformity is needed in body work despite the SNR penalty. Always verify fat saturation on the b=0 image at the beginning of the protocol.
Image SNR is the fundamental limiter of high-b-value imaging. The signal at b=2000 may be only 10-20% of the b=0 signal, and at b=3000 only a few percent. Averaging, parallel imaging, smaller matrices, and thicker slices all help but each has tradeoffs. Many modern protocols use compressed sensing or deep-learning reconstruction to recover SNR at high b-values without proportionally increasing scan time, an area of rapid commercial innovation.
Finally, gradient hardware safety and patient comfort matter. Diffusion sequences operate the gradient system near its limits and can trigger peripheral nerve stimulation, particularly in body imaging where the body coil is used. Acoustic noise is also extreme. Reviewing the St Jude Pacemaker MRI Compatibility List: A Complete Safety and Scanning Guide and other device-specific guidelines is essential before scanning patients with implants, especially with high-amplitude gradient protocols.
Practical interpretation of diffusion imaging follows a disciplined visual workflow. Begin by confirming the protocol is appropriate to the question — for stroke, b=0 and b=1000 with three directions is sufficient; for tumor characterization, add b=2000; for tractography, request DTI with 20-32 directions and isotropic voxels. Verify that the ADC map was reconstructed correctly by checking that CSF appears bright and gray matter is mid-gray. If the ADC map is missing or visibly corrupt, ask the technologist to re-reconstruct before reading.
Next, scan the b=0 image first to orient anatomy without diffusion weighting. Then scroll through the high-b-value image to identify regions of conspicuous high signal. For each suspicious focus, cross-reference the ADC map immediately. True restriction will show clearly dark ADC, often well below 0.7 × 10⁻³ mm²/s in acute pathology. Equivocal cases benefit from manual region-of-interest measurement and comparison with contralateral normal tissue.
For stroke imaging specifically, follow vascular territories. Anterior cerebral, middle cerebral, posterior cerebral, lenticulostriate, and posterior inferior cerebellar artery territories each produce characteristic patterns, and matching diffusion abnormalities to vascular maps confirms the diagnosis. Watershed infarcts appear as linear restriction at the borders between territories. Embolic showers produce multiple small scattered foci, often crossing territories, suggesting a proximal cardiac or large-vessel source.
For oncology, integrate diffusion with T2, T1 post-contrast, and dynamic perfusion. A lesion that restricts diffusion but does not enhance may be lymphoma, abscess, or a high-grade glioma with central necrosis. Look at peripheral versus central restriction patterns. Use ADC histogram analysis or texture features in research protocols to extract additional value, but remember that mean ADC alone is often as predictive as more complex metrics in routine practice.
For preparation toward registry exams, focus on physics fundamentals — the meaning of b-value, the Stejskal-Tanner sequence, the calculation of ADC, the artifacts of EPI, and the major clinical applications. Memorize approximate ADC values for normal brain, acute infarct, abscess, and high-grade tumor. Recognize T2 shine-through on sample images. Understand the difference between DWI, DTI, and advanced multi-shell techniques. Practice questions repeatedly until you can identify pitfalls instinctively.
Quality control is the technologist's frontline responsibility. Daily phantom QA should include a diffusion phantom that reports stable ADC values within 5% of vendor specification. Weekly checks for eddy-current alignment, fat saturation uniformity, and gradient calibration prevent drift. When a sequence looks degraded, suspect gradient cooling issues, helium boil-off, or coil problems before blaming the protocol — and document the issue so the service team can address it.
Finally, communicate diffusion findings clearly in the radiology report. Describe location, vascular territory if relevant, ADC value compared to normal, and the differential implications. Avoid jargon-only phrases like restricted diffusion without context; instead, write that a 1.2 cm focus of cytotoxic edema in the left MCA territory shows restricted diffusion with ADC of 0.4 × 10⁻³ mm²/s, consistent with acute infarct less than 7 days old. Clear quantitative language helps referring clinicians act on the report and supports longitudinal comparison.
Sample MRI - Magnetic Resonance Imaging Practice Questions
Try these questions from our free MRI - Magnetic Resonance Imaging practice tests. The correct answer and an explanation follow each question.
Diffusion-weighted imaging (DWI) measures the random Brownian motion of water molecules. Restricted diffusion (e.g., in acute stroke) appears as:
- A. Low signal on DWI, high ADC
- B. High signal on DWI, low ADC
- C. High signal on DWI, high ADC
- D. Low signal on DWI, low ADC
Answer: B. High signal on DWI, low ADC
In acute ischemia, cytotoxic edema restricts water movement; restricted diffusion shows high signal on DWI (b=1000) and low signal on ADC map (low diffusivity).
The b-value in diffusion-weighted imaging controls the degree of diffusion weighting. Increasing the b-value:
- A. Increases overall image SNR
- B. Increases diffusion contrast but decreases SNR
- C. Decreases T2 contribution
- D. Has no effect on image quality
Answer: B. Increases diffusion contrast but decreases SNR
Higher b-values provide greater diffusion contrast by increasing the dephasing of mobile water protons, but at the cost of reduced SNR due to greater signal attenuation from all spins.
On diffusion-weighted MRI (DWI), an acute ischemic infarct typically shows:
- A. Low signal on DWI and high ADC values
- B. High signal on DWI and low ADC values
- C. High signal on DWI and high ADC values
- D. Low signal on both DWI and ADC maps
Answer: B. High signal on DWI and low ADC values
Cytotoxic edema in acute infarction restricts water diffusion, producing high signal on DWI and low apparent diffusion coefficient (ADC) values.
SSFP (steady-state free precession) sequences such as TrueFISP/FIESTA produce contrast that is proportional to which tissue property ratio?
- A. T1/T2
- B. T2/T1
- C. TE/T2*
- D. TR/T1
Answer: B. T2/T1
SSFP signal is proportional to T2/T1 ratio; tissues with high T2/T1 (like blood and fluids) appear very bright, making SSFP ideal for cardiac cine and vascular imaging.
Take the full MRI - Magnetic Resonance Imaging practice test
MRI Questions and Answers
The History of MRI: From Discovery to Modern Medicine
MRI With and Without Contrast: How It Works, What to Expect
MRI Medical Abbreviation: What MRI Stands For and Why It Matters
MRI Imaging Centers: Complete Guide to Independent Outpatient MRI Facilities
St Jude Pacemaker MRI Compatibility List: A Complete Safety and Scanning Guide
About the Author

Medical Laboratory Scientist & Clinical Certification Expert
Johns Hopkins UniversityDr. Sandra Kim holds a PhD in Clinical Laboratory Science from Johns Hopkins University and is certified as a Medical Technologist (MT) and Medical Laboratory Scientist (MLS) through ASCP. With 16 years of clinical laboratory experience spanning hematology, microbiology, and molecular diagnostics, she prepares candidates for ASCP board exams, MLT, MLS, and specialist certification tests.
Join the Discussion
Connect with other students preparing for this exam. Share tips, ask questions, and get advice from people who have been there.
View discussion (8 replies)