EEG Test Images: A Visual Guide to Brain Wave Patterns and What They Mean
Explore EEG test images and learn what brain wave patterns mean. Understand normal vs. abnormal results, costs, and what to expect. 🎯

Understanding eeg test images is one of the most powerful ways to make sense of what happens during an electroencephalogram. When a neurologist or EEG technologist reviews the output of an what is a eeg test, they are examining a continuous paper or digital readout of electrical signals produced by millions of neurons firing in coordinated patterns across the brain. These visual tracings — called waveforms — are the core diagnostic tool behind one of neurology's most important procedures.
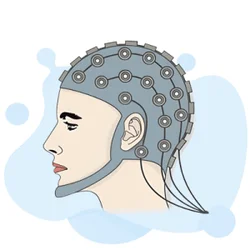
An EEG medical test works by placing small metal electrodes on the scalp according to a standardized map called the 10-20 system. Each electrode picks up tiny voltage fluctuations — measured in microvolts — and transmits them to an amplifier. The resulting signal is plotted as a series of undulating lines, each representing a different region of the brain. When you look at EEG test images, you are essentially watching the brain's electrical biography unfold in real time, second by second.
The patterns captured in EEG images vary enormously depending on a person's state of consciousness, age, and neurological health. During relaxed wakefulness with eyes closed, most healthy adults produce prominent alpha waves oscillating between 8 and 13 cycles per second (Hz) over the posterior regions of the head. Open the eyes and those alpha waves attenuate, replaced by faster, lower-amplitude beta activity in the 13 to 30 Hz range. These predictable transitions form the baseline against which abnormalities are judged.
Clinicians use EEG images to diagnose epilepsy, monitor seizure activity, evaluate sleep disorders, assess encephalopathy, and confirm brain death in certain clinical scenarios. The eeg brain test is uniquely valuable because it captures moment-to-moment electrical activity with millisecond precision — something that structural imaging tools like MRI or CT scans cannot do. While MRI shows anatomy, an EEG shows physiology in motion, which is why the two are often ordered together for a complete neurological picture.
For technologists preparing for board certification, learning to interpret EEG test images is non-negotiable. The R. EEG T. and CLTM examinations administered by ABRET test candidates on their ability to recognize normal and abnormal waveform morphologies, understand artifacts, and apply activation procedures correctly. Reviewing annotated EEG images during study is one of the most efficient ways to build the visual pattern recognition skills these exams demand.
This guide will walk you through the major categories of waveforms you will encounter in clinical EEG tracings — from normal background rhythms to the sharp spikes and spike-wave complexes associated with epilepsy. We will also cover eeg test price ranges, what to expect during the procedure, how long the test takes, and how to prepare. Whether you are a patient scheduled for your first EEG or a technologist sharpening your interpretation skills, the visual roadmap ahead will help you read these images with confidence.
EEG Test by the Numbers

The Five Core EEG Waveform Types
The slowest EEG waveforms, delta waves dominate during deep NREM sleep in healthy adults. In awake adults, prominent delta activity signals serious pathology such as structural lesions, metabolic encephalopathy, or seizure postictal states.
Theta activity is normal in children and during drowsiness or light sleep. Excessive theta in an awake adult — especially focal theta over one hemisphere — suggests cortical dysfunction or a subcortical lesion in that region.
The hallmark of relaxed wakefulness, alpha rhythms dominate over posterior head regions with eyes closed. Alpha should attenuate when eyes open. Absent or asymmetric alpha is a key abnormality visible in standard EEG test images.
Fast, low-amplitude beta reflects active thinking, anxiety, or the pharmacological effect of benzodiazepines and barbiturates. Asymmetric beta reduction over one hemisphere can indicate an underlying structural abnormality beneath the skull.
The fastest clinically recognized EEG rhythm, gamma activity is associated with high-level cognitive processing. In clinical EEG, gamma is less commonly evaluated than lower frequencies but plays a growing role in research settings.
Reading EEG test images requires a systematic approach that begins with assessing the overall background organization. A well-organized background means that the dominant posterior rhythm is clearly alpha, symmetrical between hemispheres, and appropriate for the patient's age and level of alertness. Disorganization — where no clear dominant rhythm emerges and multiple frequencies intermingle without structure — is one of the earliest and most reliable signs of diffuse cerebral dysfunction, such as toxic-metabolic encephalopathy or a severe infectious process affecting the brain globally.
Epileptiform abnormalities are the most clinically urgent findings in EEG images, and they come in several characteristic shapes. Spikes are sharply contoured waveforms that last less than 70 milliseconds and stand out clearly against the background activity. Sharp waves are similar but have a duration between 70 and 200 milliseconds, giving them a slightly broader, less needle-like appearance. Both spikes and sharp waves indicate cortical hyperexcitability in the region where they are maximal, and both can occur independently or as part of spike-wave complexes.
Spike-wave complexes — particularly the classic 3 Hz generalized spike-wave discharge — are the iconic EEG signature of absence epilepsy. When you examine EEG images showing absence seizures, you will see a sudden, simultaneous eruption of spike-wave activity across all channels, appearing from baseline without warning, lasting typically 5 to 30 seconds, and then cutting off just as abruptly. During this discharge, the patient is behaviorally unresponsive, which is why absence seizures are often mistaken for daydreaming by teachers and parents.
Focal epileptiform discharges look quite different. In temporal lobe epilepsy — the most common form of focal epilepsy in adults — sharp waves or spikes are maximal over the temporal electrodes (T7, T8, or their neighbors) and may show phase reversal, meaning the waveform flips polarity at the electrode sitting directly over the epileptic focus. Recognizing phase reversal in EEG test images is a critical skill for localizing the seizure onset zone before surgical evaluation.
Artifacts represent a major interpretive challenge in EEG images and can mimic both normal rhythms and pathological discharges. Muscle artifact produces high-frequency, irregular activity that can obscure the underlying cerebral signal, particularly over frontotemporal regions during facial movement or chewing. Eye blink artifact creates large, slow deflections in the frontal channels (Fp1, Fp2) that result from the corneoretinal potential sweeping across the electrodes as the eyelids move. Electrode pop — a sudden spike in a single channel caused by poor electrode-scalp contact — is particularly deceptive because it looks almost identical to a true epileptiform discharge.
Understanding how long is an eeg test matters because many abnormalities only emerge during specific states of consciousness. A routine 20- to 40-minute EEG captures only a limited window of brain activity, and epileptiform discharges may be absent simply because the patient did not drift into drowsiness or light sleep during the recording. Sleep is a powerful activator of epileptiform activity, particularly in frontal and temporal lobe epilepsy, which is why prolonged or overnight EEG studies dramatically increase diagnostic yield compared to routine recordings.
Periodic patterns represent another category of EEG findings that trained readers must recognize in clinical images. Generalized periodic discharges (GPDs) — formerly called GRDA or burst suppression in certain contexts — repeat at regular intervals across all channels and are associated with severe, often life-threatening conditions including anoxic brain injury after cardiac arrest, Creutzfeldt-Jakob disease, and severe metabolic encephalopathies. Lateralized periodic discharges (LPDs), previously called PLEDs, are confined to one hemisphere and strongly suggest an acute focal structural lesion such as a stroke, abscess, or rapidly growing tumor. The presence of LPDs on EEG images should trigger urgent clinical evaluation.
What Is an EEG Medical Test? Procedure, Purpose, and Results
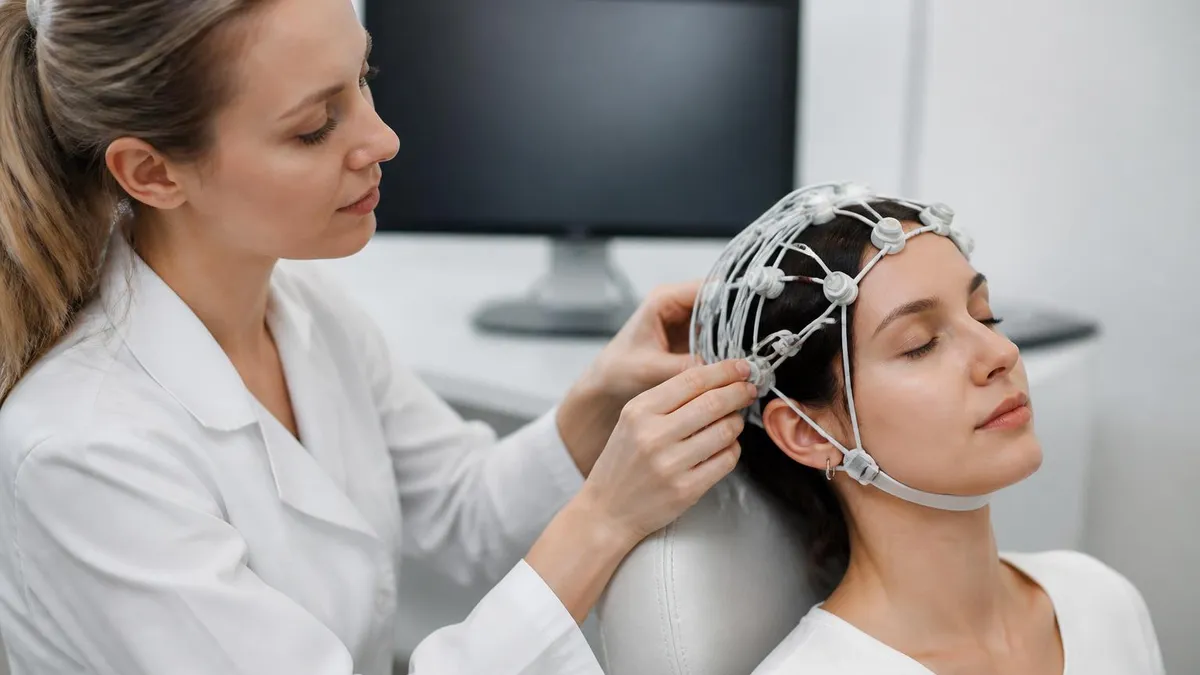
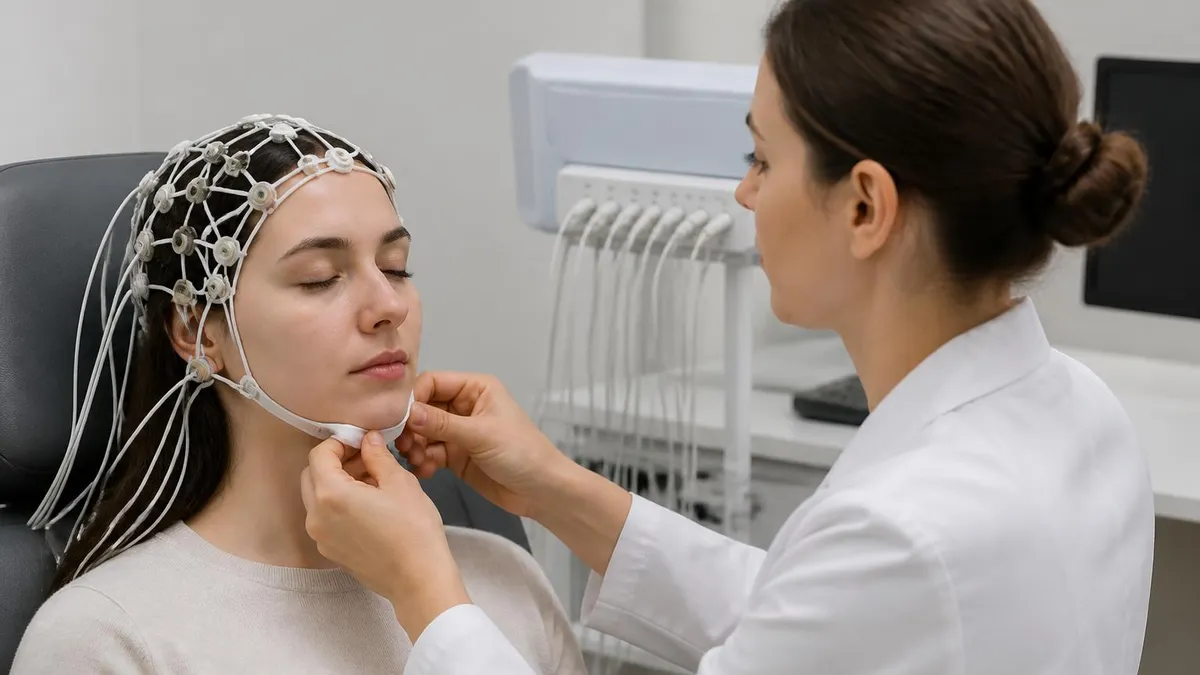
During an EEG medical test, a trained technologist applies 19 to 25 metal disc electrodes to precise scalp locations using a conductive gel or paste. The electrode placement follows the international 10-20 system, a standardized map that ensures recordings are reproducible and comparable across different labs and countries. The entire setup process typically takes 20 to 30 minutes, and the actual recording lasts another 20 to 40 minutes for a routine study, though some extended protocols run considerably longer.
Once recording begins, you will be asked to lie still with your eyes closed while the technologist monitors the tracing in real time on a computer screen. You may be prompted to breathe rapidly for three minutes (hyperventilation) and to look at a strobe light flickering at varying frequencies (photic stimulation) — both are activation procedures designed to provoke abnormal activity that might not appear at rest. The procedure is entirely painless and involves no electricity entering the brain; the electrodes only listen, they do not transmit.

Pros and Cons of the EEG Test
- +Non-invasive and completely painless — no needles, no radiation, no contrast agents required
- +Provides real-time, millisecond-resolution data on brain electrical activity that no other imaging test can match
- +Highly sensitive for detecting epileptiform discharges, especially during prolonged or sleep-deprived recordings
- +Widely available at hospitals, neurology clinics, and outpatient imaging centers across the United States
- +Relatively affordable compared to MRI or PET scans, especially with insurance coverage
- +Can be performed at the bedside in ICU or emergency settings without moving critically ill patients
- −A single routine EEG may miss epileptiform activity if no discharges occur during the short recording window
- −Artifact contamination — from muscle movement, electrode issues, or environmental interference — can make tracings difficult to interpret
- −EEG does not show brain structure, so it cannot diagnose tumors, strokes, or other anatomical lesions on its own
- −Electrode application is time-consuming and the gel used can be messy and difficult to wash out of hair completely
- −Interpretation requires highly specialized training, and inter-rater agreement between reviewers is imperfect
- −Some patients find lying still for 30 to 40 minutes uncomfortable, particularly those with chronic pain or anxiety
EEG Test Preparation Checklist
- ✓Wash and dry your hair the night before or morning of the test — do not use conditioner, oils, or styling products.
- ✓Take all regularly prescribed medications as usual unless your neurologist has specifically told you otherwise.
- ✓Avoid caffeine for 8 to 12 hours before the test, as caffeine can alter brain wave patterns and interfere with results.
- ✓Get a normal night of sleep unless your doctor has ordered a sleep-deprived EEG protocol.
- ✓Eat a light meal before the test to prevent low blood sugar, which can affect the tracing quality.
- ✓Wear comfortable, loose-fitting clothing and avoid jewelry or hair accessories that may interfere with electrode placement.
- ✓Arrive 10 to 15 minutes early to complete paperwork and allow the technologist adequate setup time.
- ✓Inform the technologist of all medications, supplements, and recreational substances taken in the past 48 hours.
- ✓Let the technologist know if you have any scalp conditions, skin sensitivities, or latex allergies before setup begins.
- ✓Plan for the electrode removal process — bring a comb and extra shampoo if you need to return to work afterward.
Sleep Dramatically Increases EEG Diagnostic Yield
Research consistently shows that EEG recordings capturing drowsiness and light sleep (Stage N1 and N2) detect epileptiform discharges in 30 to 50% more patients than awake-only recordings. If your routine EEG is normal but seizures are still suspected, ask your neurologist about a prolonged or sleep-deprived study before concluding the EEG is truly negative.
The eeg test cost in the United States varies significantly depending on the type of study ordered, the facility where it is performed, and whether the patient has insurance coverage. A routine outpatient EEG at a hospital-based neurology department typically costs between $400 and $700 before insurance adjustments. At a freestanding outpatient imaging or neurology clinic, prices may run somewhat lower — often in the $200 to $450 range — because overhead costs at non-hospital facilities tend to be reduced. These figures represent the billed amount, not necessarily what a patient with insurance will actually pay out of pocket.
For patients with private insurance, the actual out-of-pocket eeg test price depends on deductibles, copayment or coinsurance requirements, and whether the facility is in-network. Many commercial insurance plans cover EEGs when ordered for a medically appropriate indication such as seizure evaluation, encephalopathy workup, or syncope assessment. Patients who have met their annual deductible may pay as little as $20 to $50 in copayments; those early in their deductible cycle may be responsible for a larger share. Always verify coverage with your insurer before the appointment to avoid surprise billing.
Medicare Part B covers outpatient EEGs as a diagnostic test, typically reimbursing approximately 80% of the Medicare-approved amount after the annual Part B deductible is satisfied. Medicaid coverage varies by state but generally covers medically necessary EEGs. The Medicare national average payment for a routine EEG (CPT code 95816 for awake and drowsy, or 95819 for awake and asleep) was approximately $100 to $180 in 2024 — much lower than what private insurers or cash patients are typically billed, reflecting significant negotiated rate differences.
Uninsured patients or those paying cash have several options for reducing their eeg test cost. Many hospital systems offer financial assistance programs or charity care for patients below certain income thresholds. Community health centers and federally qualified health centers often provide EEGs on a sliding fee scale. Some independent neurology practices will negotiate a cash-pay discount of 20 to 40% off their standard rate if asked in advance. Additionally, comparing prices using healthcare cost transparency tools — which hospitals are now required to publish online — can reveal meaningful price variation between nearby facilities for the exact same procedure.
The eeg test side effects are minimal, which is one reason EEG remains so widely ordered despite the existence of more advanced neuroimaging technologies. The most commonly reported discomfort is mild scalp irritation at electrode sites, particularly if the conductive paste used is not fully removed afterward. Some patients experience transient dizziness during the hyperventilation activation procedure, which is intentional — the mild cerebral vasospasm induced by overbreathing can provoke absence seizures or other abnormalities that confirm a diagnosis. The dizziness resolves within seconds once normal breathing resumes.
Photosensitive patients may experience discomfort or anxiety during photic stimulation as the strobe light flickers at seizure-provoking frequencies — typically between 1 and 30 Hz. In rare cases, photic stimulation can trigger a true photoparoxysmal response, meaning the EEG shows epileptiform discharges in response to the light. If this happens, the technologist stops the stimulation immediately and the response subsides rapidly. Patients with known photosensitive epilepsy are still tested because the documented response is clinically important, but the technologist takes extra precautions. Outside of these activation procedures, the EEG itself carries essentially no side effects or risks.
Extended EEG monitoring, such as 24-hour ambulatory EEG or inpatient video-EEG telemetry, costs considerably more than a routine study. A full inpatient video-EEG unit admission for epilepsy presurgical evaluation can cost $5,000 to $15,000 or more per day before insurance, and typical admissions last 3 to 7 days. These studies are conducted at specialized epilepsy centers and are almost always covered by insurance when properly authorized. The goal is to capture habitual seizures on video while simultaneously recording the EEG, providing both behavioral and electrical documentation of the seizure onset zone for surgical planning.

If a routine 20- to 40-minute EEG comes back normal but your neurologist still suspects epilepsy based on your symptoms, ask specifically about ambulatory EEG monitoring (24–72 hours) or inpatient video-EEG telemetry. A normal short EEG does not rule out epilepsy — it simply means no discharges occurred during that specific recording window. Prolonged monitoring captures a much larger sample of your brain's electrical activity across multiple sleep-wake cycles.
For EEG technologists preparing for board certification through ABRET, mastering the visual vocabulary of EEG test images is the single most important study task. The R. EEG T. examination (Registered Electroencephalographic Technologist) tests candidates across multiple domains — patient care, electrode application, technical EEG, and clinical EEG knowledge — but the clinical EEG section, which involves recognizing and categorizing waveform patterns, is consistently the most challenging area for candidates without extensive clinical mentorship experience. Building a robust mental library of annotated EEG images accelerates this skill development dramatically.
Effective image-based study involves more than passively looking at tracings. For each EEG image you review, practice asking a structured set of questions: What is the dominant posterior rhythm frequency and amplitude? Is it symmetric? Does it attenuate appropriately with eye opening? Are there any focal slow waves, and if so, over which electrodes are they maximal?
Are there any sharply contoured waveforms that could represent epileptiform discharges, and do they show an after-going slow wave? Are there any artifacts present, and can I identify their source? This systematic approach mirrors what experienced neurologists do mentally and builds the automaticity that exam conditions demand.
The eeg brain test platforms used in clinical practice — including Natus NeuroWorks, Persyst, Nihon Kohden, and Cadwell Sierra — all display waveforms in slightly different visual styles, with adjustable filters, sensitivity settings, and display speeds.
Experienced technologists learn to adjust these parameters to optimize waveform visualization: increasing the high-frequency filter to reduce muscle artifact, lowering the low-frequency filter to suppress slow electrode drift, or changing the display sensitivity to reveal subtle amplitude asymmetries. Understanding how these technical parameters affect the appearance of EEG test images is tested on the R. EEG T. exam and is essential for accurate clinical interpretation.
One particularly challenging category of EEG images involves distinguishing normal variants from true abnormalities. Wicket spikes — sharply contoured, arch-shaped waveforms that appear over temporal regions during drowsiness in middle-aged adults — can be mistaken for epileptiform sharp waves by less experienced readers.
Benign epileptiform transients of sleep (BETS), also called small sharp spikes (SSS), are very low-amplitude, brief discharges that appear in light sleep and are not associated with epilepsy despite their epileptiform name. Fourteen-and-six Hz positive bursts, mu rhythm, and the posterior slow wave of youth are additional normal variants that appear abnormal to untrained eyes and must be recognized confidently in board examination image questions.
Continuous EEG monitoring (cEEG) in the ICU setting has expanded dramatically over the past decade, and interpreting the images generated by days-long recordings presents unique challenges. Non-convulsive seizures and non-convulsive status epilepticus are common in critically ill patients — studies suggest they occur in 20 to 30% of patients in neurological ICUs — and they produce no obvious clinical manifestations that bedside nurses or physicians can detect without EEG.
The compressed spectral array (CSA) and density spectral array (DSA) are color-coded trend displays that compress hours of EEG data into a single image, allowing rapid visual scanning for seizure patterns, sleep cycling, and EEG suppression. Learning to read these trending displays is an increasingly important skill for advanced EEG practitioners.
Neonatal EEG interpretation represents a highly specialized subset of EEG image reading with its own unique normal variants, developmental milestones, and seizure patterns. Newborn brains produce discontinuous background activity with periods of electrical quiescence (interburst intervals) that would be profoundly abnormal in adults.
Neonatal seizures are frequently subclinical — meaning they cause abnormal EEG discharges without obvious clinical movements — making continuous EEG monitoring in the NICU essential for detecting and treating seizure activity. The morphology of neonatal epileptiform discharges differs from adult patterns, tending to be more rhythmic and slower in frequency, and they often evolve in location and character across the scalp during a single ictal event.
Practicing with real annotated EEG images, working through case-based question banks, and seeking supervised feedback from experienced neurologists or senior technologists are the three most impactful activities for building EEG image interpretation skills. Online image atlases, textbook atlases such as Ebersole and Pedley's comprehensive reference, and structured review courses offered by ASET (the American Society of Electroneurodiagnostic Technologists) all provide valuable visual training resources. Combining image review with practice questions that test clinical reasoning — not just pattern memorization — is the approach most likely to translate into both exam success and real-world clinical competence.
Whether you are a patient preparing for your first EEG or a technologist building board exam readiness, a few practical strategies will maximize your success with EEG test images and the overall EEG experience. For patients, the single most important preparation step is washing your hair thoroughly the night before and avoiding all styling products on test day.
Oily or product-coated hair increases electrode impedance, which degrades signal quality and may require the technologist to spend extra time troubleshooting connections. Clean, dry hair produces the lowest impedance and the clearest EEG tracing, making the entire study go more smoothly and efficiently.
Patients often ask whether they should stop their seizure medications before an EEG to increase the chance of capturing abnormalities. The answer is almost never — stopping antiseizure medications without physician guidance is dangerous and can precipitate severe breakthrough seizures or status epilepticus. Neurologists who want a medication-reduced study manage this process carefully in a supervised setting, not on a self-directed outpatient basis. For routine diagnostic EEG, continue all medications as prescribed and give the technologist a complete medication list at check-in so the reading physician can factor pharmacological effects into the interpretation.
For EEG technologists and students, building a personal image library of annotated EEG tracings is one of the highest-return study investments you can make. Every time you encounter a teaching case — whether in a clinical rotation, a textbook, an online atlas, or an ABRET practice question — save the image with clear annotations labeling the waveform features, electrode locations, and clinical significance. Over months of study, this personal collection becomes a highly effective review tool precisely because you built it yourself, which deepens encoding and recall compared to passively reviewing someone else's annotations.
Time management during the ABRET examination is critical because the image-based sections require both rapid pattern recognition and careful analysis. Experienced candidates recommend spending no more than 60 to 90 seconds on any single EEG image question during the exam. If you cannot identify the key feature within that window, mark the question and return to it at the end — do not let one difficult image question derail your pacing for the entire section.
The most commonly missed image questions involve normal variants that mimic epileptiform discharges, so devote extra study time to wicket spikes, BETS, rhythmic temporal theta of drowsiness (RTTD), and subclinical rhythmic electrographic discharges of adults (SREDA).
Understanding the technical factors that affect EEG image quality is as important as recognizing the clinical patterns. Sensitivity (measured in microvolts per millimeter), filter settings (low-frequency and high-frequency filters), and display speed (commonly 30 mm per second in North America) all influence how waveforms appear on screen.
Changing the sensitivity from the standard 7 uV/mm to a higher value compresses all waveforms and may cause high-amplitude abnormalities to run off the page, while a lower sensitivity value spreads waveforms and may reveal subtle, previously invisible rhythms. Board candidates must understand how these adjustments work and be able to predict how a tracing would look different if settings were changed.
Activation procedures — hyperventilation, photic stimulation, and sleep deprivation — are covered extensively on EEG board examinations because they are both technically important and clinically consequential. Hyperventilation induces cerebral vasoconstriction by lowering arterial CO2, which reduces cerebral blood flow and increases neuronal excitability. This makes it particularly effective at provoking absence seizures in susceptible patients.
Photic stimulation activates the visual cortex rhythmically, and a photoparoxysmal response — epileptiform discharges time-locked to the flash frequency — is a clinically significant finding that confirms photosensitive epilepsy. These activation procedures must be performed correctly and safely, with awareness of contraindications such as recent stroke for hyperventilation and known photosensitive epilepsy triggers for photic stimulation.
Finally, remember that EEG interpretation is never done in a vacuum — clinical context always matters. The same EEG tracing may be interpreted very differently depending on whether it was recorded from a 6-month-old infant, a 35-year-old with a first seizure, or an 80-year-old with dementia.
Age-specific norms for background frequency, sleep architecture, and the expected presence of certain waveforms change dramatically across the lifespan, and applying adult norms to pediatric patients is one of the most common interpretive errors. Invest time in learning the developmental trajectory of EEG patterns from neonatal life through old age — it is tested on board exams and is essential for safe, accurate clinical practice.
EEG Questions and Answers
EEG Electroencephalography Practice Test PDF (Free Printable 2026)
Sleep EEG: How Overnight Brain Wave Testing Works and What Your Results Mean
EEG Test Cost in 2026: Prices, Insurance Coverage, and How to Save

EEG Systems: A Complete Guide to the EEG Test, How It Works, and What to Expect

Travel EEG Tech Jobs: The Complete Guide to Working as a Mobile Electroencephalography Technologist
About the Author
Educational Psychologist & Academic Test Preparation Expert
Columbia University Teachers CollegeDr. Lisa Patel holds a Doctorate in Education from Columbia University Teachers College and has spent 17 years researching standardized test design and academic assessment. She has developed preparation programs for SAT, ACT, GRE, LSAT, UCAT, and numerous professional licensing exams, helping students of all backgrounds achieve their target scores.