
EEG Signal Processing Explained: From Back Averaging to Clean Brain Wave Data
📝 Learn how EEG signal processing works, from back averaging EEG to filtering and artifact removal. Understand the EEG test, cost, side effects, and results.
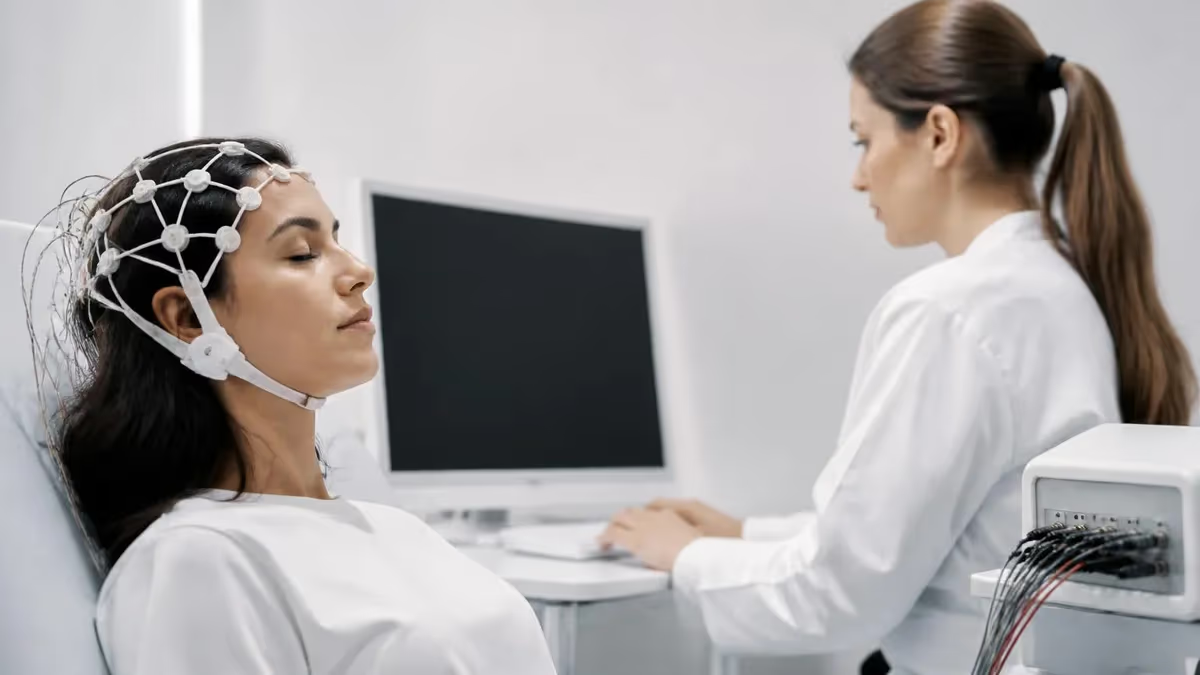
If you have ever wondered how a noisy tangle of squiggly lines becomes a usable clinical recording, the answer is EEG signal processing. An EEG test captures tiny electrical voltages from the scalp, and techniques like back averaging EEG pull a clean, time-locked signal out of that background noise. Back averaging works by aligning many short segments of data to a repeated event, then averaging them so random fluctuations cancel out while the consistent response remains visible and measurable for the reading neurologist.
This guide walks through the core ideas a technologist or curious patient needs to understand the journey from raw voltage to interpretable waveform. We cover amplification, filtering, sampling rates, artifact rejection, montages, and event-related averaging. Along the way you will see why a clean recording depends as much on careful electrode placement and patient cooperation as it does on the digital math running behind the scenes. Good signal processing rescues marginal data, but it cannot fully fix a sloppy setup.
Understanding signal processing also demystifies your results. When a report mentions a sharp transient, a spike, or a time-locked potential, those findings emerge from processing steps that isolate meaningful brain activity from heartbeat, muscle, eye blink, and electrical interference. If you want a plain-language refresher on the exam itself, our explainer on what is a eeg test covers the basics before we dive into the technical layers that follow in this article.
The phrase "signal processing" sounds intimidating, but the building blocks are intuitive. A signal is just voltage changing over time. Processing means transforming that voltage so the part you care about stands out. Every step, from the differential amplifier to the digital filter, exists to improve the ratio of true brain signal to unwanted noise. The higher that ratio, the more confident a clinician can be that what they see is real cortical activity rather than an artifact.
Back averaging is one of the most elegant examples of this principle. Imagine a patient with sudden involuntary jerks. The myoclonic jerk is easy to detect on a muscle channel, but the cortical event that may have triggered it is buried in ongoing background rhythm. By using the jerk as a trigger and averaging the EEG in the moments before each jerk, hidden cortical spikes can emerge from the noise, revealing whether the movement has a brain origin.
We will keep the explanations practical and tied to real clinical workflows. Whether you are studying for a credential, preparing for your own appointment, or simply fascinated by neuroscience, this article connects the abstract math to the equipment, the patient, and the final report. By the end you should be able to follow a recording from the first electrode contact through filtering, averaging, and interpretation, and to explain in your own words why each processing decision matters for diagnosis.
EEG Signal Processing by the Numbers

How Raw EEG Is Captured and Conditioned
Small metal sensors are placed on the scalp with conductive gel or paste. Low impedance contact, ideally under 5 kilohms, ensures the faint cortical voltages reach the amplifier without distortion or added noise.
Each channel compares two electrode voltages and amplifies the difference. This common-mode rejection cancels signals shared by both inputs, such as line noise, while boosting the local brain activity by thousands of times.
The amplified analog signal is sampled many times per second and stored as numbers. Sampling rate and bit depth decide how faithfully fast transients and small voltage steps are preserved for later processing.
Channels are arranged into bipolar or referential montages. The chosen montage reshapes how activity appears, helping localize a focus or highlight a widespread rhythm without changing the underlying recorded data.
Filtering is where raw EEG starts to look clinically usable. A high-pass filter removes slow drift caused by sweat, movement, or electrode settling, while a low-pass filter trims fast noise from muscle and electronics. A notch filter at 60 hertz suppresses the electrical hum from US power lines. Together these filters define the frequency window the reader sees, typically about 0.5 to 70 hertz for routine work, narrower or wider depending on what the clinician needs to evaluate.
Choosing filter settings is a balancing act. Aggressive filtering produces a smooth, attractive trace, but it can erase or distort the very transients that matter. Over-filtering a sharp spike can blunt it until it resembles harmless background, while too little filtering buries findings under noise. Skilled technologists adjust settings thoughtfully and document them, because two recordings of the same brain can look strikingly different under different filter parameters. The numbers on the report are not arbitrary.
Sampling rate is equally important. The Nyquist principle states you must sample at least twice as fast as the highest frequency you want to capture. A 256 hertz sample rate reliably represents activity up to about 100 hertz, which covers nearly all clinical EEG. Research into high-frequency oscillations, sometimes linked to seizure-generating tissue, may push sampling to 1,000 hertz or more so those rapid events are not lost during digitization or smeared across samples.
Bit depth determines voltage resolution. EEG signals are tiny, often only tens of microvolts, so the converter must distinguish very small steps. Modern systems commonly use 16 to 24 bits, giving thousands of gradations across the input range. Higher resolution means subtle changes in amplitude survive digitization intact, which matters when averaging dozens of trials where small, consistent differences accumulate into a measurable response that would vanish in a coarse recording.
Reference choice shapes everything downstream. Because each channel measures a difference, the reference electrode is effectively part of every reading. A noisy or active reference contaminates all channels at once. Technologists may re-reference data digitally after recording, switching to an average reference or a linked-ears reference to clarify a finding. This flexibility is a major advantage of digital EEG over the old paper machines that locked montages permanently in ink.
All of this conditioning sets the stage for advanced techniques. Once data is cleanly amplified, filtered, sampled, and referenced, you can apply time-locked averaging, spectral analysis, and source modeling with confidence. The career path behind this work is rewarding, too; if you are curious about the field, our overview of how long is an eeg test touches on the technologists who manage these settings daily and the expertise their role demands.
It helps to remember that processing is iterative, not a single button press. A technologist may capture data, notice excessive muscle artifact, coach the patient to relax the jaw, adjust the low-pass filter, and re-evaluate, all within a session. Good recordings come from combining solid technique at the bedside with judicious digital adjustments, never from relying on software to rescue fundamentally poor data after the patient has already gone home.

EEG Practice Test Questions
Prepare for the EEG - Electroencephalography exam with our free practice test modules. Each quiz covers key topics to help you pass on your first try.
EEG Abnormal Epileptiform Patterns
EEG Exam Questions covering Abnormal Epileptiform Patterns. Master EEG Test concepts for certification prep.
EEG Activation Procedures
Free EEG Practice Test featuring Activation Procedures. Improve your EEG Exam score with mock test prep.
EEG Artifact Identification
EEG Test Prep for Artifact Identification. Practice EEG Quiz questions and boost your score.
EEG Electrode Placement and Montages
EEG Questions and Answers on Electrode Placement and Montages. Free EEG practice for exam readiness.
EEG - Electroencephalography Abnormal Epil...
EEG Mock Test covering - Electroencephalography Abnormal Epileptiform Patterns. Online EEG Test practice with instant feedback.
EEG - Electroencephalography Activation Pr...
Free EEG Quiz on - Electroencephalography Activation Procedures. EEG Exam prep questions with detailed explanations.
EEG - Electroencephalography Artifact Iden...
EEG Practice Questions for - Electroencephalography Artifact Identification. Build confidence for your EEG certification exam.
EEG - Electroencephalography Electrode Pla...
EEG Test Online for - Electroencephalography Electrode Placement and Montages. Free practice with instant results and feedback.
EEG - Electroencephalography Instrumentati...
EEG Study Material on - Electroencephalography Instrumentation and Calibration. Prepare effectively with real exam-style questions.
EEG - Electroencephalography Neuroanatomy ...
Free EEG Test covering - Electroencephalography Neuroanatomy and Physiology. Practice and track your EEG exam readiness.
EEG - Electroencephalography Non-Epileptif...
EEG Exam Questions covering - Electroencephalography Non-Epileptiform Abnormalities. Master EEG Test concepts for certification prep.
EEG - Electroencephalography Normal EEG Wa...
Free EEG Practice Test featuring - Electroencephalography Normal EEG Waveforms. Improve your EEG Exam score with mock test prep.
EEG - Electroencephalography Patient Safet...
EEG Mock Exam on - Electroencephalography Patient Safety and Ethics. EEG Study Guide questions to pass on your first try.
EEG - Electroencephalography Pediatric and...
EEG Test Prep for - Electroencephalography Pediatric and Neonatal EEG. Practice EEG Quiz questions and boost your score.
EEG ICU and Continuous EEG Monitoring
EEG Questions and Answers on ICU and Continuous EEG Monitoring. Free EEG practice for exam readiness.
EEG Instrumentation and Calibration
EEG Mock Test covering Instrumentation and Calibration. Online EEG Test practice with instant feedback.
EEG Neuroanatomy and Physiology
Free EEG Quiz on Neuroanatomy and Physiology. EEG Exam prep questions with detailed explanations.
EEG Non-Epileptiform Abnormalities
EEG Practice Questions for Non-Epileptiform Abnormalities. Build confidence for your EEG certification exam.
EEG Normal EEG Waveforms
EEG Test Online for Normal EEG Waveforms. Free practice with instant results and feedback.
EEG Patient Safety and Ethics
EEG Study Material on Patient Safety and Ethics. Prepare effectively with real exam-style questions.
What Is an EEG Test and How Processing Fits In
An EEG test, short for electroencephalogram, records the brain's electrical activity through electrodes placed on the scalp. It is painless, noninvasive, and widely used to evaluate seizures, sleep disorders, encephalopathy, and altered consciousness. The machine captures voltage changes that signal processing then cleans and organizes into readable waveforms.
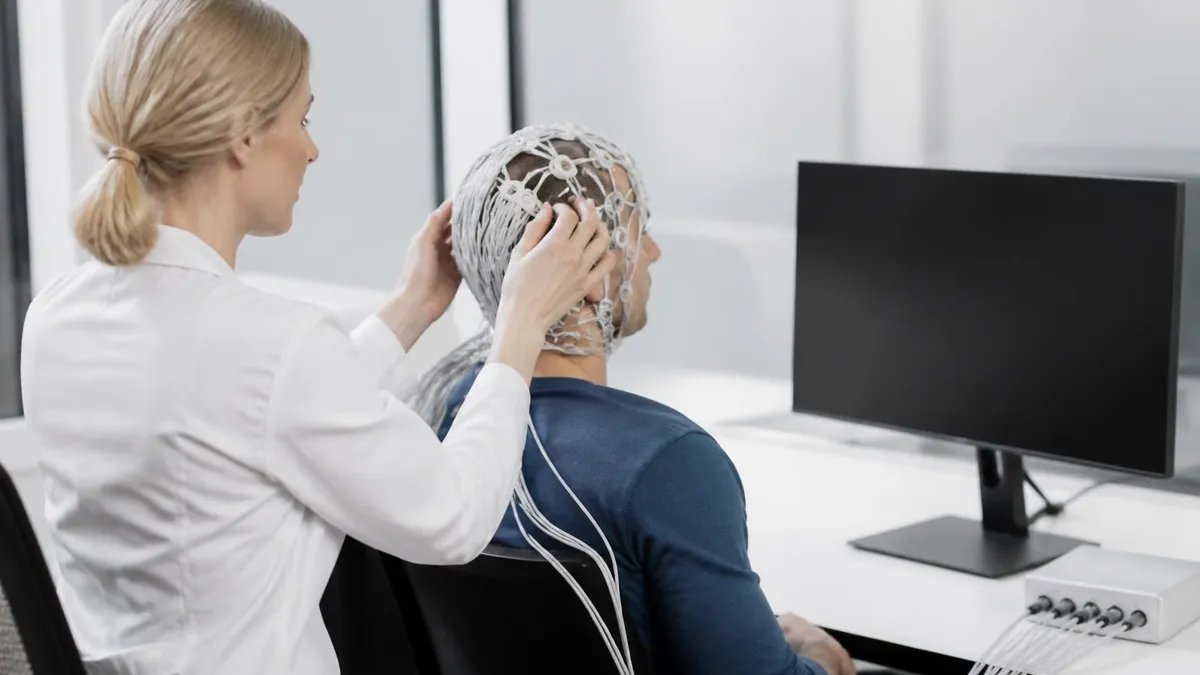
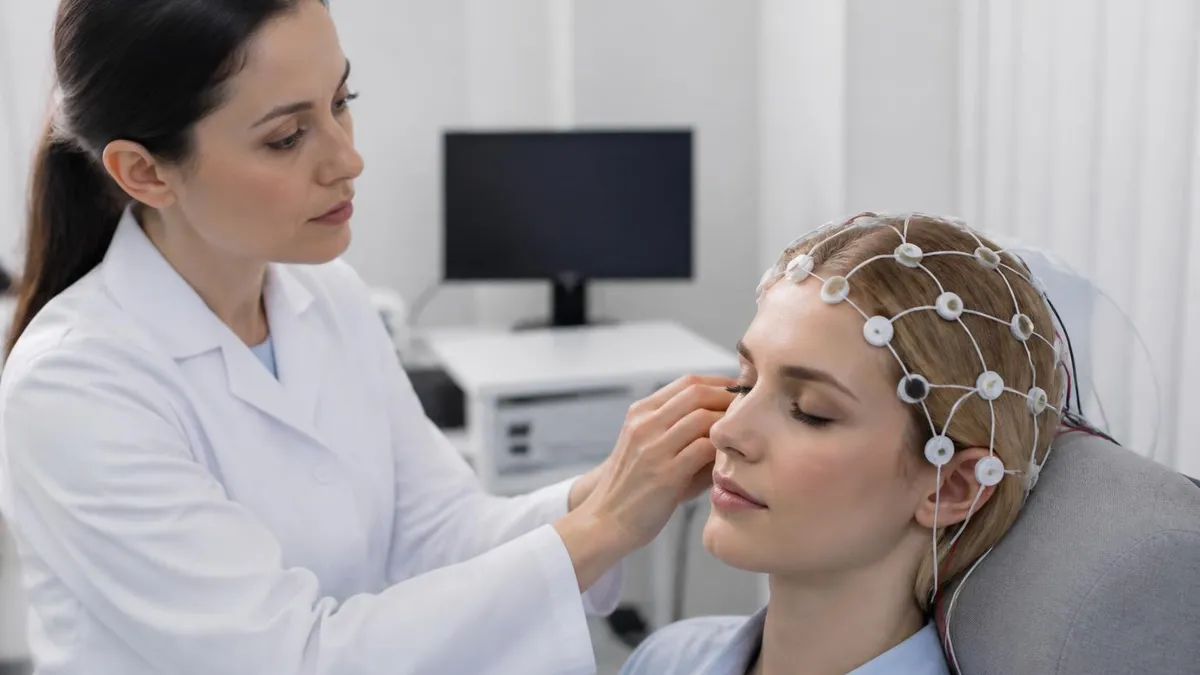
The procedure itself is straightforward. A technologist measures your head, applies electrodes with gel, and asks you to rest, blink, or breathe deeply on cue. Behind the scenes, amplification and filtering run continuously so the neurologist later sees clean traces rather than raw electrical chaos from muscle, movement, and environment.
Back Averaging EEG: Strengths and Limitations
- +Reveals tiny cortical spikes hidden in ongoing background activity
- +Improves signal-to-noise ratio by canceling random fluctuations
- +Links involuntary movements to a possible brain origin
- +Uses data already recorded, requiring no extra patient burden
- +Helps classify myoclonus as cortical, subcortical, or peripheral
- +Works alongside EMG channels for precise time-locking
- −Requires many repeated, consistent events to average effectively
- −Inconsistent trigger timing smears the averaged waveform
- −Cannot recover signal that was never recorded cleanly
- −Demands careful artifact rejection before averaging begins
- −Results depend heavily on accurate event marking
- −Not useful for single, non-repeating clinical events

Artifact Reduction Checklist for a Clean EEG Test
- ✓Confirm every electrode impedance reads below 5 kilohms.
- ✓Wash and dry the scalp to remove oils before applying gel.
- ✓Secure electrode wires so movement does not create swing artifact.
- ✓Ask the patient to relax the jaw and shoulders to cut muscle noise.
- ✓Place dedicated channels to monitor eye blinks and movement.
- ✓Engage the 60 hertz notch filter to suppress US line interference.
- ✓Verify the reference electrode is quiet and well attached.
- ✓Coach steady breathing except during hyperventilation tasks.
- ✓Mark obvious artifacts in real time for later exclusion.
- ✓Re-check setup after position changes or long recording gaps.
Clean input beats clever math
No filter or averaging algorithm can fully recover a finding that was buried by poor electrode contact. The single biggest improvement to any recording is low, balanced impedance at the source. Invest your effort at setup, and every downstream processing step becomes more reliable and more diagnostic.
Back averaging deserves a step-by-step walkthrough because it is both powerful and frequently misunderstood. The goal is to find a brain event that occurs reliably just before a repeated physical event, most often a sudden muscle jerk in patients with myoclonus. The muscle jerk is recorded on an electromyography channel and is easy to detect. The cortical event that may cause it, however, is far too small to see in any single sweep of the ongoing EEG background.
The first step is event detection. Software or a technologist marks the precise onset of each jerk using the EMG channel, creating a series of time stamps called triggers. Accuracy here is everything. If the trigger lands at slightly different points in the jerk from trial to trial, the averaged EEG that follows will be smeared and any true cortical spike will blur into the background, defeating the entire purpose of the technique you are running.
Next comes epoching. A window of EEG is extracted around each trigger, typically including a stretch before the jerk and a shorter stretch after it. Because back averaging looks for a cause, the pre-event window is the region of interest. Each epoch is screened for artifacts, and any segment contaminated by movement, blinks, or noise is discarded so it cannot distort the final result with random, non-time-locked voltage swings.
Then the epochs are averaged sample by sample. Random background activity differs from trial to trial, so when you add many epochs and divide, those fluctuations tend toward zero. Anything that occurs at the same time relative to the trigger, however, survives and even strengthens. With enough clean trials, a consistent cortical spike preceding the jerk emerges from the flat averaged line as a clear, measurable, time-locked deflection.
Interpreting the averaged waveform answers the clinical question. A sharp cortical transient appearing a short, physiologically plausible interval before the jerk supports cortical myoclonus. The absence of any such transient points toward a subcortical or peripheral source instead. The timing relationship, measured in milliseconds, is the diagnostic payload, which is why precise triggering and clean epochs matter so much throughout the entire averaging workflow described above.
The number of trials needed varies. Some patients jerk many times per minute, letting you accumulate fifty to a hundred clean epochs quickly. Others jerk rarely, stretching the recording and testing patience. There is no fixed magic number; you average until the waveform stabilizes and the result stops changing meaningfully as you add more trials. Statistical confidence grows roughly with the square root of the trial count, so improvements slow as the count climbs.
Finally, results are documented with the parameters used: trigger source, epoch length, filter settings, and trial count. Reproducibility depends on this record. Another reviewer should be able to read the report and understand exactly how the averaged waveform was produced, because the conclusion about a cortical origin rests entirely on choices made during processing, not on a casual visual impression of the unaveraged background rhythm.
If event triggers are placed inconsistently relative to the true onset of each jerk, the averaged waveform smears and a real cortical spike can disappear entirely. Always validate trigger placement on the EMG channel before trusting a back averaging result, and re-mark events if timing looks scattered.
Reading processed EEG results means understanding what the numbers and waveforms on your report actually represent. A clinician interprets rhythms by frequency, amplitude, location, and reactivity. Alpha activity around eight to twelve hertz appearing over the back of the head when the eyes are closed is a normal, healthy sign. Slowing, asymmetry, or sharp epileptiform discharges raise concern. Signal processing is what makes these distinctions visible and measurable rather than guesswork on a noisy page.
Spectral analysis complements visual reading. By applying a Fourier transform, software breaks the signal into its component frequencies and shows how much power sits in each band. This quantitative view helps detect subtle slowing or excess fast activity that the eye might miss, and it underpins tools like the spectrogram used in long-term monitoring to compress hours of data into a single, scannable color map of changing brain rhythms over time.
Patients often ask about the practical details, and those matter too. The eeg test cost depends on the type of study, the facility, and your insurance, ranging from a few hundred dollars for a routine recording to several thousand for prolonged video monitoring. Knowing what drives the price helps you ask informed questions and avoid surprise bills, especially when a doctor recommends an extended or inpatient study.
Visual interpretation still anchors clinical EEG despite all the automation. A trained neurologist scans the full recording, montage by montage, looking for patterns that software flags but cannot fully judge. Automated spike detectors are useful screening aids, yet they generate false positives from artifact and miss atypical findings. Human review remains the standard of care, with processing acting as a powerful assistant rather than a replacement for expert judgment built over years of practice.
Source localization extends interpretation further in specialized centers. By modeling how voltages spread across many electrodes, software can estimate where in the brain a discharge originated. This is especially valuable in epilepsy surgery planning, where pinpointing the seizure focus guides whether and where to operate. Such modeling demands dense electrode arrays, accurate head geometry, and careful processing, but it can meaningfully change a patient's treatment path when done well.
Ultimately, the processed report is a collaboration between machine and clinician. The equipment captures and conditions the signal, algorithms enhance and quantify it, and the neurologist interprets it within the context of your symptoms and history. Understanding this chain helps you read your own results with realistic expectations, ask better questions at follow-up, and appreciate why a careful, well-processed recording is worth the time it takes to produce.
If you are preparing to perform or interpret EEG, a few practical habits separate reliable recordings from frustrating ones. Start with relentless attention to impedance, because every later step inherits the quality of that first electrode contact. Spend the extra minutes prepping the scalp, seating electrodes firmly, and confirming low, balanced readings across the head. Technologists who rush setup almost always pay for it later with artifact-riddled data that even the best software cannot fully salvage during review.
Document your settings as you go. Record filter cutoffs, sample rate, montage, and any changes made mid-recording. When a colleague reviews the study, that documentation lets them understand exactly what they are seeing and whether a finding is genuine or a processing artifact. Reproducibility is the backbone of clinical credibility, and a well-annotated recording protects both the patient and the interpreting physician from avoidable misunderstandings about how the data was produced.
For back averaging specifically, validate your triggers before trusting any average. Scroll through the EMG channel and confirm that each marked event sits at a consistent point on the jerk. Discard ambiguous events rather than letting them blur your result. It is better to average forty clean, well-timed epochs than a hundred sloppy ones. Quality of triggering matters far more than raw quantity when you are hunting for a faint, time-locked cortical spike.
Learn to recognize the common artifacts on sight. Eye blinks produce large frontal deflections, muscle creates fast spiky activity at the head's edges, and a swinging electrode wire generates rhythmic slow waves. Knowing these signatures lets you exclude them confidently and avoid mistaking them for pathology. Many false alarms in automated detection come from artifacts that an experienced human dismisses in a fraction of a second after a little focused practice.
Keep studying the underlying signal theory, even informally. Understanding why a notch filter removes line noise, why Nyquist sets your minimum sample rate, and how averaging suppresses randomness makes you a smarter operator. You will choose better settings, troubleshoot problems faster, and explain results more clearly to patients and physicians. The math is not just academic; it directly shapes the everyday decisions that determine whether a recording is diagnostic or wasted effort.
Finally, use practice questions to cement these concepts. Working through realistic scenarios about montages, filters, artifacts, and epileptiform patterns builds the pattern-recognition speed that real recordings demand. Pair that study with hands-on time whenever possible, and revisit your weak areas regularly. EEG signal processing rewards steady, deliberate practice, and the confidence you gain translates directly into cleaner recordings, sharper interpretations, and better outcomes for the patients whose brains you are working to understand.
EEG Questions and Answers
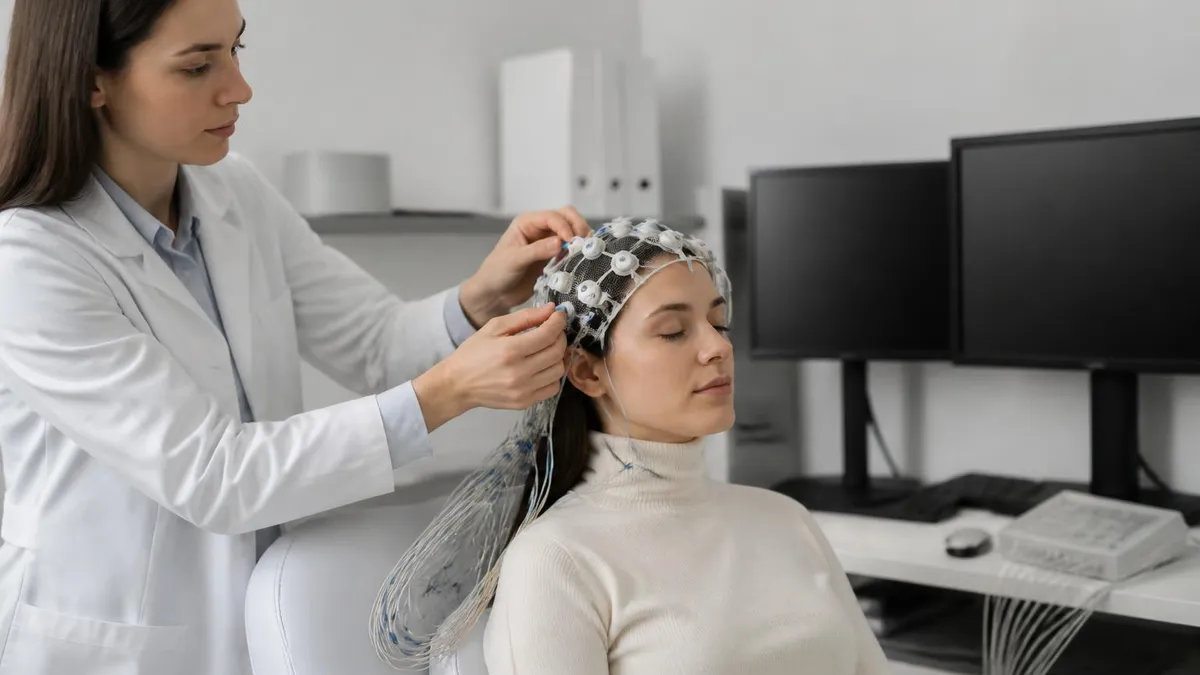
EEG for Seizures: How the Test Diagnoses Epilepsy and What to Expect
EEG Tech Salary 2026: Pay by State, Experience, and Certification
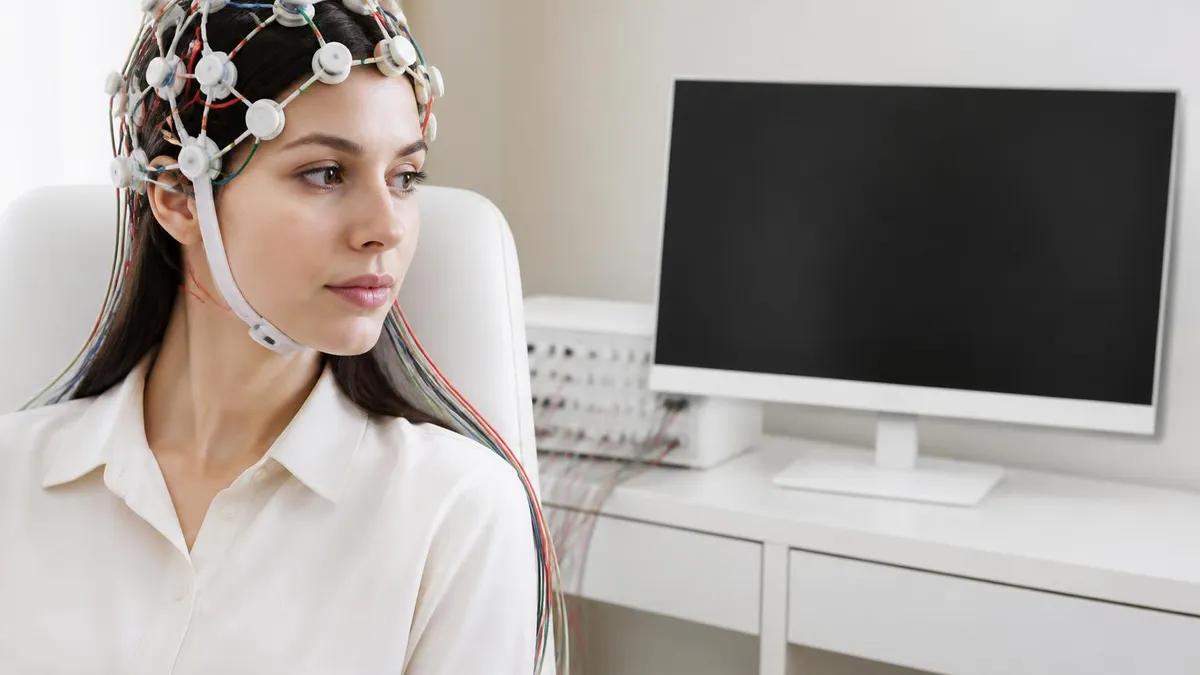
EEG Images: A Visual Guide to Brain Wave Patterns, Recordings, and Test Results
What Does an EEG Measure? Brain Waves, Electrical Activity, and What Your Results Reveal
24 Hour EEG: What to Expect, How It Works, Costs, and Results Explained
About the Author

Educational Psychologist & Academic Test Preparation Expert
Columbia University Teachers CollegeDr. Lisa Patel holds a Doctorate in Education from Columbia University Teachers College and has spent 17 years researching standardized test design and academic assessment. She has developed preparation programs for SAT, ACT, GRE, LSAT, UCAT, and numerous professional licensing exams, helping students of all backgrounds achieve their target scores.