
T1 vs T2 MRI: Understanding the Two Core MRI Sequences and How They Differ
🗨️ t1 mri vs t2 mri explained simply: learn how each MRI sequence works, what tissues look bright or dark, and when radiologists use each one.
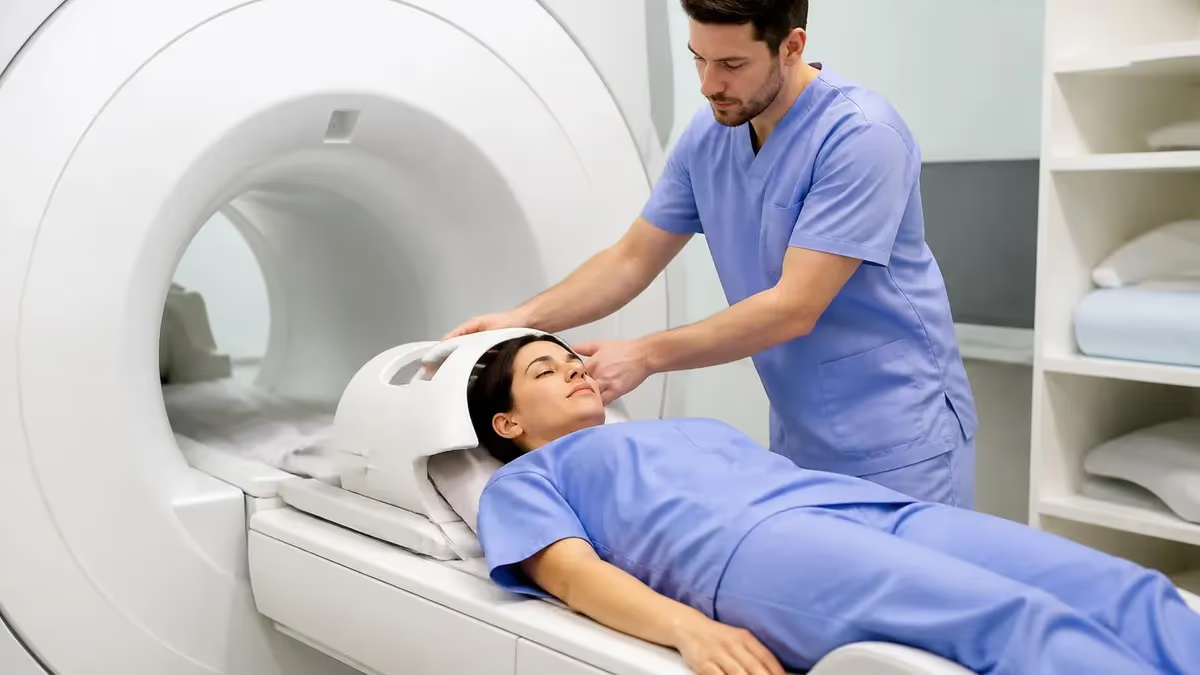
The comparison of t1 mri vs t2 mri sits at the heart of clinical magnetic resonance imaging, and understanding it is essential for technologists, students, and curious patients alike. Every MRI scanner can generate many image weightings, but T1-weighted and T2-weighted sequences are the two foundational contrasts radiologists rely on every single day. When you grasp how each sequence highlights tissue differently, the gray-and-white world of an MRI scan suddenly becomes readable, revealing fluid, fat, edema, and disease with remarkable clarity and diagnostic confidence.
At the simplest level, the difference between T1 and T2 images comes down to how the scanner times its measurements after exciting hydrogen protons with a radiofrequency pulse. T1 weighting emphasizes how quickly protons release absorbed energy back into surrounding tissue, while T2 weighting emphasizes how quickly protons fall out of phase with one another. These two relaxation processes happen at different speeds in fat, water, muscle, and pathology, producing the distinct contrast patterns that make each sequence uniquely valuable for specific clinical questions.
The fastest mental shortcut most students learn is the fluid rule: on a T1-weighted image, water and cerebrospinal fluid appear dark, while on a T2-weighted image that same fluid appears bright. Fat behaves almost oppositely, looking bright on T1 and somewhat less bright on conventional T2. This single relationship explains the majority of what you will see when scrolling through a brain, spine, or knee study, and it gives you a reliable anchor before you memorize anything more complicated about pulse sequences.
Why does any of this matter clinically? Because most pathology involves extra water. Tumors, infection, inflammation, infarction, and swelling all increase tissue water content, and increased water lights up brightly on T2-weighted imaging. That is why radiologists frequently scan a region with both sequences: T1 provides crisp anatomical detail and shows fat-containing structures, while T2 acts as a sensitive flashlight for disease. Reading them side by side turns subtle abnormalities into obvious findings that would be missed on either sequence alone.
The terms T1 and T2 actually refer to specific time constants measured in milliseconds. T1, the longitudinal relaxation time, describes recovery of magnetization along the main magnetic field. T2, the transverse relaxation time, describes decay of the signal in the perpendicular plane. The scanner manipulates two operator-controlled parameters, repetition time and echo time, to favor one process over the other. Short values produce T1 weighting; long values produce T2 weighting, and the math behind that is surprisingly approachable once illustrated.
Throughout this guide we will break down each sequence step by step, compare how common tissues appear on both, and walk through real clinical scenarios where the choice between them changes a diagnosis. Whether you are preparing for a registry exam, learning to assist with scans, or simply trying to understand your own report, mastering the relationship between these two weightings is the single most useful skill in MRI interpretation and the foundation everything else builds upon.
T1 vs T2 MRI by the Numbers
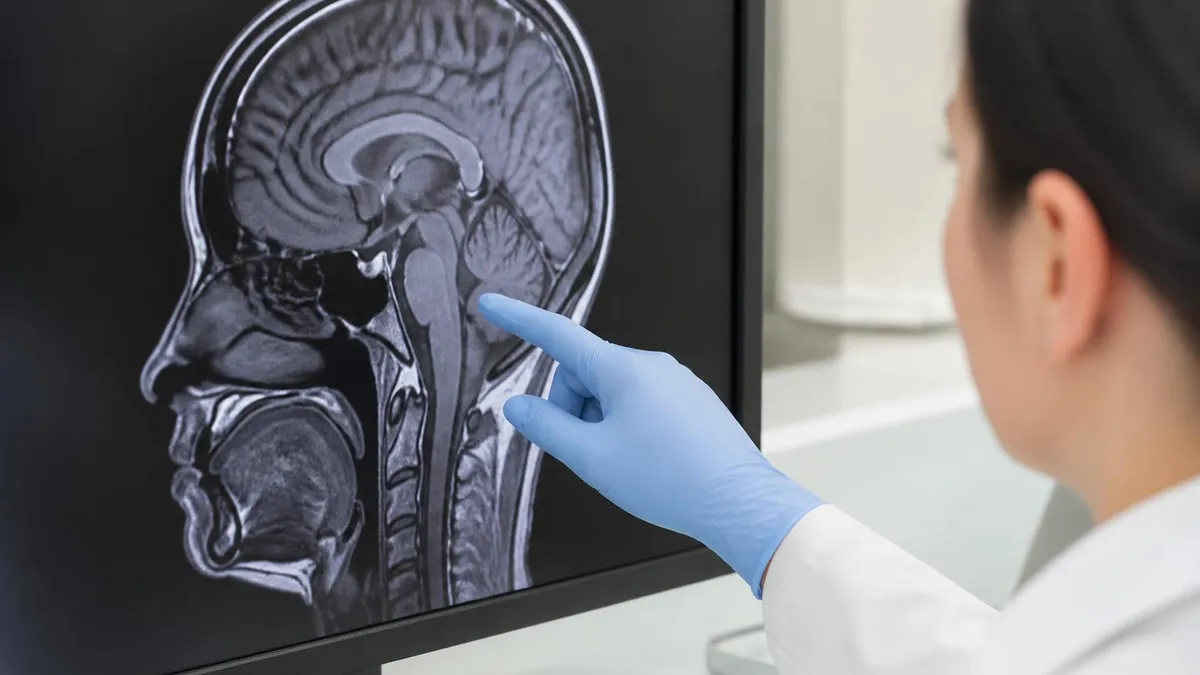
How T1 and T2 Sequences Work
TR is the interval between successive radiofrequency excitation pulses. A short TR produces T1 weighting because tissues with fast recovery regain signal; a long TR reduces T1 effects and lets T2 differences dominate the final image contrast.
TE is the delay between the excitation pulse and signal measurement. A short TE produces T1-weighted contrast, while a long TE produces T2 weighting by allowing tissues with slow dephasing, like fluid, to retain bright signal.
Longitudinal relaxation describes how protons release energy and realign with the main magnetic field. Fat recovers quickly and appears bright on T1; water recovers slowly and appears dark, giving sharp anatomical detail.
Transverse relaxation describes how proton spins lose phase coherence after excitation. Water holds coherence longest and stays bright on T2, making this sequence exquisitely sensitive to edema, inflammation, and most pathology.
To truly understand t1 mri vs t2 mri, the most practical approach is to memorize how everyday tissues appear on each sequence and then reason from there. On a T1-weighted image, fat is the brightest structure, which is why subcutaneous tissue, bone marrow, and fatty organs glow white. Muscle appears intermediate gray, and pure water structures such as cerebrospinal fluid, urine, and joint effusions appear dark. This pattern makes T1 the go-to sequence for crisp anatomy, since the high signal of fat outlines organs and tissue planes beautifully.
On a T2-weighted image, the relationships shift in a way that initially confuses students. Water-rich structures now become the brightest objects in the picture, so cerebrospinal fluid, edema, cysts, and joint fluid light up white. Fat remains fairly bright on conventional spin-echo T2 but is suppressed on fat-saturated variants, which radiologists deliberately use to make pathologic fluid stand out. Muscle again appears intermediate. Because almost every disease process raises local water content, T2 functions as a sensitive screening tool across the entire body.
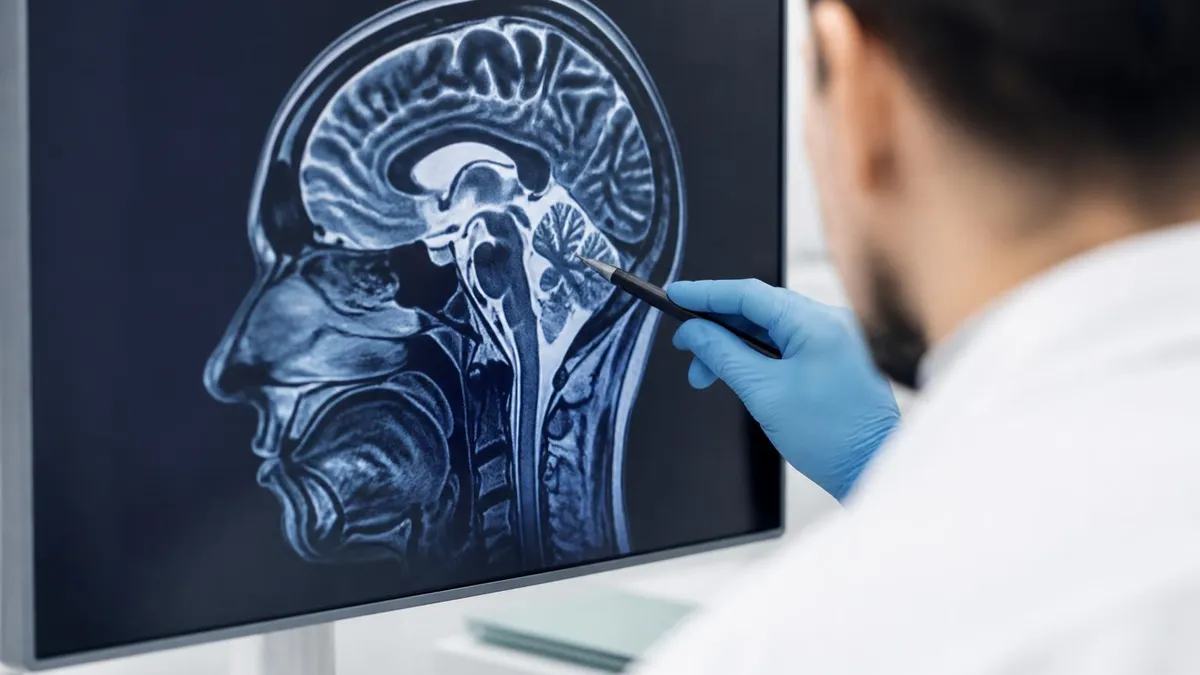
A clean way to remember the fluid behavior is the mnemonic that water is dark on T1 and white on T2. Picture a brain scan: the ventricles filled with cerebrospinal fluid appear black on T1 but glow white on T2. Once you anchor to that single landmark, you can usually classify any unlabeled image in seconds simply by looking at whether the fluid spaces are bright or dark, then confirming with fat-containing structures nearby.
Not every structure follows the simple fluid rule, and the exceptions are clinically important. Proteinaceous fluid, blood in certain stages, melanin, and gadolinium contrast can all shorten T1 and appear bright on T1-weighted images even though they contain fluid. Flowing blood may appear dark due to flow voids on both sequences. These nuances are exactly what separates a beginner from an experienced reader, and they explain why radiologists never rely on a single sequence to characterize a lesion fully.
Bone and air can trip up newcomers because both appear dark on T1 and T2. Cortical bone and air contain very few mobile hydrogen protons, so they generate almost no signal regardless of weighting. This is why MRI is excellent for soft tissue but relatively poor for detailed cortical bone evaluation, where computed tomography excels. Recognizing these signal-void structures keeps you from mistaking a normal finding, like a sinus full of air, for genuine pathology on the images.
Putting the patterns together, a confident reader scans a study by first identifying the sequence, then checking whether fluid behaves as expected, and finally hunting for tissue that breaks the rules. Bright signal on T2 where none should exist signals possible edema, tumor, or infection. Abnormal brightness on a non-contrast T1 hints at fat, blood, or protein. This systematic habit, built on a firm grasp of tissue appearance, dramatically reduces missed findings and builds the reflexive interpretation skill clinicians use thousands of times each year.
MRI Practice Test Questions
Prepare for the MRI - Magnetic Resonance Imaging exam with our free practice test modules. Each quiz covers key topics to help you pass on your first try.
MRI Knowledge
MRI Exam Questions covering Knowledge. Master MRI Test concepts for certification prep.
MRI Physics
Free MRI Practice Test featuring Physics. Improve your MRI Exam score with mock test prep.
MRI Anatomy and Pathology
MRI Test Prep for MRI Anatomy and Pathology. Practice MRI Quiz questions and boost your score.
MRI Anatomy and Positioning
MRI Questions and Answers on MRI Anatomy and Positioning. Free MRI practice for exam readiness.
MRI Contrast Agents
Free MRI Quiz on MRI Contrast Agents. MRI Exam prep questions with detailed explanations.
MRI Patient Care and Positioning
MRI Practice Questions for MRI Patient Care and Positioning. Build confidence for your MRI certification exam.
T1 vs T2 Weighting Explained
T1-weighted imaging is produced using a short repetition time and a short echo time, which lets the scanner emphasize differences in longitudinal relaxation between tissues. Fat recovers its magnetization quickly, so it produces a strong, bright signal, while water recovers slowly and appears dark. The result is an image that looks anatomically natural and crisp, making it ideal for evaluating structures, defining margins, and assessing fatty marrow.
Clinically, T1 sequences excel at showing anatomy, identifying fat and subacute blood, and serving as the baseline for contrast-enhanced studies. After gadolinium injection, abnormal tissue that takes up contrast becomes bright on T1, highlighting tumors, infection, and active inflammation. Because of this, T1 imaging is the workhorse for post-contrast evaluation across the brain, spine, abdomen, and musculoskeletal system in everyday radiology practice.
When to Favor T1 vs T2 Imaging
- +T1 gives crisp, natural-looking anatomical detail
- +T1 is the standard sequence for post-contrast gadolinium imaging
- +T1 clearly shows fat, fatty marrow, and subacute blood
- +T2 is highly sensitive to edema, inflammation, and most pathology
- +T2 makes fluid-filled cysts and effusions instantly obvious
- +Reading both together greatly narrows the differential diagnosis
- −T1 can miss subtle edema that only T2 reveals
- −T2 fluid brightness can obscure small lesions near CSF
- −Both sequences show cortical bone and air as dark signal voids
- −Flow voids in vessels can mimic pathology on either sequence
- −Bright T1 signal has many causes that require additional sequences
- −Neither alone reliably characterizes a lesion without comparison
How to Identify T1 vs T2 MRI Images
- ✓Locate a fluid-filled space such as the ventricles or bladder.
- ✓If the fluid is dark, you are likely viewing a T1-weighted image.
- ✓If the fluid is bright white, you are likely viewing a T2-weighted image.
- ✓Confirm by checking fat: bright fat supports T1 weighting.
- ✓Look for fat saturation, which suppresses fat on many T2 sequences.
- ✓Check muscle, which appears intermediate gray on both sequences.
- ✓Identify cortical bone and air as dark signal voids on both.
- ✓Note any bright T1 signal that may indicate fat, blood, or protein.
- ✓Scan for bright T2 areas that may represent edema or disease.
- ✓Review the sequence label or parameters in the image header to verify.
Water is dark on T1, bright on T2
If you remember nothing else, anchor to this: cerebrospinal fluid and water appear dark on T1-weighted images and bright on T2-weighted images. Fat does the reverse on standard sequences. With this single landmark you can classify almost any unlabeled MRI image in seconds before reasoning through the exceptions.
The clinical value of comparing t1 mri vs t2 mri becomes obvious once you follow real diagnostic scenarios. In neuroimaging, a suspected stroke illustrates the partnership perfectly. Acute ischemic tissue accumulates water, so it appears bright on T2 and on the related fluid-attenuated sequence, alerting the radiologist to the infarcted region. T1 imaging then provides the anatomical framework and, after contrast, can reveal blood-brain barrier breakdown. Together the sequences localize the lesion, estimate its age, and guide urgent treatment decisions in the emergency setting.
Multiple sclerosis is another classic example where T2 sensitivity shines. Demyelinating plaques scattered through the white matter contain increased water and appear as bright lesions on T2-weighted and FLAIR images, often before symptoms become severe. Radiologists count and map these lesions to support diagnosis and monitor disease progression over time. Post-contrast T1 imaging adds crucial information by showing which plaques are actively inflamed and enhancing, distinguishing new disease activity from older, stable scars that no longer require aggressive therapy.
In musculoskeletal imaging, knee and joint studies rely heavily on the contrast between the two weightings. A meniscal tear or cartilage defect fills with joint fluid that appears bright on T2-weighted and fluid-sensitive sequences, making the abnormality conspicuous against darker surrounding tissue. T1 imaging displays the fatty marrow and bony anatomy clearly, helping detect fractures, marrow replacement, and tumors. Orthopedic surgeons depend on this combination to plan procedures, confirm soft tissue injuries, and assess healing after operative repair of complex joints.
Spine imaging shows the same complementary logic at work daily. On a sagittal lumbar study, cerebrospinal fluid in the thecal sac appears bright on T2, outlining the spinal cord and nerve roots and revealing disc herniations that compress neural structures. T1 imaging defines vertebral marrow and detects fatty or metastatic replacement of bone. A bright T2 signal within a disc or vertebra prompts concern for infection, edema, or degeneration that the radiologist then characterizes with additional sequences and clinical correlation.
Abdominal and pelvic MRI extends these principles to organs rich in soft tissue contrast. The liver, kidneys, and reproductive organs each have characteristic signal patterns, and lesions are classified by how they behave across T1, T2, and contrast phases. A simple renal cyst, for instance, follows fluid: dark on T1, bright on T2, and non-enhancing. A solid tumor breaks that pattern, showing intermediate signal and enhancement. This systematic comparison underpins confident characterization of masses throughout the body.
Even in oncology follow-up, the two sequences serve distinct roles that together tell a complete story. T2 imaging detects tumor-associated edema and fluid, flagging suspicious regions across an organ or limb. Post-contrast T1 imaging reveals which tissue is vascular and actively growing, guiding biopsy targets and treatment response assessment. By integrating findings from both weightings, radiologists move beyond simply spotting an abnormality to explaining its nature, extent, and likely behavior, which is exactly what referring physicians need to manage patients well.
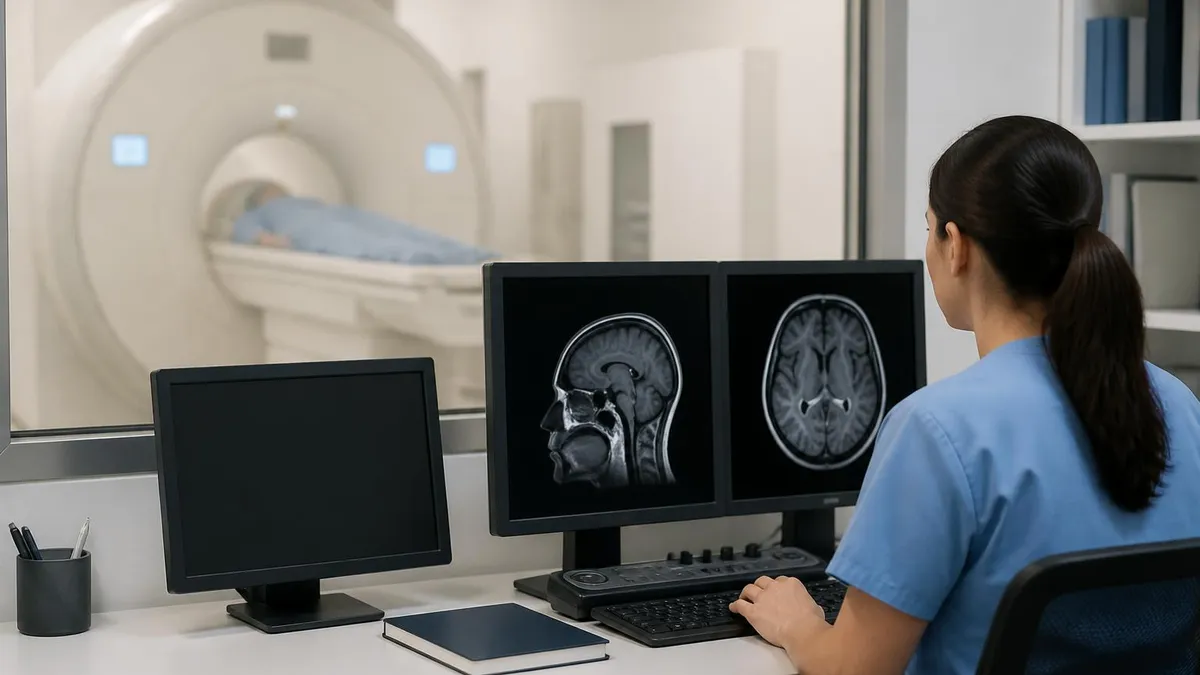
A common interpretation error is assuming any bright structure on a T1-weighted image must be fat. Subacute hemorrhage, proteinaceous fluid, melanin, and gadolinium contrast all shorten T1 and appear bright. Always correlate with fat-saturated and T2 sequences before concluding a lesion is benign fat, since misreading blood or tumor can have serious clinical consequences.
Reading MRI images confidently requires more than knowing which tissues are bright; it demands a systematic approach to every study. Experienced radiologists begin by confirming the sequence type, orientation, and any special techniques such as fat saturation or contrast administration. They then compare T1 and T2 images of the same slice side by side, tracking how each structure behaves. This disciplined habit prevents tunnel vision, where attention fixates on an obvious finding while a subtler but more important abnormality on the companion sequence goes completely unnoticed.
Gadolinium-based contrast agents add a powerful dimension to T1 imaging that deserves special attention. After injection, tissues with increased blood supply or disrupted barriers take up contrast and become bright on T1-weighted images. This enhancement pattern distinguishes active tumor from surrounding edema, highlights infection, and reveals inflammatory disease. Radiologists almost always compare pre-contrast and post-contrast T1 sequences, because only the change in signal, not brightness alone, reliably indicates genuine enhancement and the underlying vascular or pathologic process driving it.
Safety is inseparable from MRI practice, and technologists must screen every patient thoroughly before scanning regardless of which sequences are planned. The powerful static magnetic field poses risks for patients with certain implants, pacemakers, aneurysm clips, or metallic foreign bodies. Screening forms, verbal interviews, and documentation of implant compatibility protect patients from serious harm. Understanding device labeling, including MRI-conditional and MRI-unsafe designations, is a core competency that appears on registry examinations and matters profoundly in daily clinical workflow.
Gadolinium contrast carries its own safety considerations that every practitioner should understand. Patients with severely impaired kidney function face a small risk of nephrogenic systemic fibrosis, so renal function is often checked before administration. Allergic reactions, though uncommon, require preparedness. Newer macrocyclic agents have improved the safety profile considerably, but informed consent and appropriate screening remain essential. Balancing the diagnostic benefit of enhancement against these risks is a routine clinical judgment radiologists and technologists make collaboratively for each examination.
Image artifacts can mimic or obscure pathology, so recognizing them is part of reading any T1 or T2 study. Motion blurs detail, metal creates signal voids and distortion, and chemical shift produces dark and bright bands at fat-water interfaces. Flow within vessels can appear dark as a flow void or bright depending on technique. Knowing how these artifacts present on each weighting keeps a reader from mistaking a technical flaw for genuine disease and helps technologists adjust protocols to produce diagnostic images.
Finally, accurate interpretation always returns to clinical context, because identical signal patterns mean different things in different patients. A bright T2 focus in the brain of a young adult with neurologic symptoms suggests demyelination, while the same finding in an older patient with vascular risk factors may represent chronic small-vessel change. Integrating patient history, laboratory data, and prior imaging with the signal characteristics on T1 and T2 transforms pattern recognition into genuine diagnosis, which is the ultimate goal of every magnetic resonance examination performed.
For students and technologists preparing to master t1 mri vs t2 mri, a few practical study strategies make the material stick far better than rote memorization. Start by building a mental reference image for each sequence using a normal brain, since the cerebrospinal fluid landmark is so reliable. Train yourself to glance at the ventricles first and immediately call the weighting. This reflex becomes second nature with repetition and gives you a stable foundation before tackling the trickier exceptions involving blood, fat, and protein.
Create simple comparison tables and quiz yourself actively rather than passively rereading notes. List common tissues down one column and their T1 and T2 appearance across the rows, then cover the answers and recall them aloud. Active recall and spaced repetition dramatically outperform highlighting text. Reviewing real labeled cases, where you predict the signal before checking the answer, cements the patterns and exposes the gaps in your understanding that pure theory tends to hide from you.
When studying for registry or board examinations, pay close attention to the parameter relationships that control weighting. Examiners love to ask how changing repetition time and echo time affects image contrast. Remember the shorthand: short repetition time and short echo time produce T1 weighting, while long repetition time and long echo time produce T2 weighting. Understanding the underlying relaxation physics, rather than memorizing isolated facts, lets you answer reworded questions you have never seen before with genuine confidence.
Practice with the exceptions deliberately, because they generate a disproportionate share of exam questions and clinical errors. Make flashcards for substances that are bright on T1 despite containing fluid, such as fat, subacute hemorrhage, melanin, proteinaceous material, and gadolinium. Then make a separate set for things that are dark on both sequences, like cortical bone, air, calcium, and rapidly flowing blood. Mastering these two short lists eliminates the most common interpretation mistakes that trip up newcomers in both testing and practice.
Hands-on experience accelerates learning more than any textbook can. If you have access to a workstation, scroll through complete studies and narrate your interpretation to a colleague or mentor. Verbalizing why a structure is bright or dark forces you to apply principles rather than recognize pictures. Seek feedback on cases you misread, and keep a personal log of confusing examples. Over weeks, this deliberate practice transforms scattered facts into the fluent, integrated reasoning that defines a competent reader.
Finally, connect every concept back to patient care, because that purpose makes the knowledge memorable and meaningful. When you understand that T2 brightness usually means extra water from disease, and that T1 with contrast reveals active vascular tissue, you stop seeing abstract physics and start seeing diagnoses. Combine consistent practice questions, real case review, and a firm grasp of the core fluid rule, and the relationship between these two essential sequences will become one of the most dependable tools in your imaging skill set.
MRI Questions and Answers
MRI of Cervical Spine: Complete Guide to Imaging, Anatomy, Pathology, and Patient Preparation
MRI Medical Abbreviation: What MRI Stands For and Why It Matters
Knee MRI Images: A Complete Guide to Reading, Understanding, and Interpreting Knee Scans
ICD 10 Codes for MRI: Complete Guide to Abnormal MRI Coding, Documentation, and Reimbursement
Is Nickel Titanium MRI Compatible? A Complete Guide to MRI Safety Materials
About the Author

Medical Laboratory Scientist & Clinical Certification Expert
Johns Hopkins UniversityDr. Sandra Kim holds a PhD in Clinical Laboratory Science from Johns Hopkins University and is certified as a Medical Technologist (MT) and Medical Laboratory Scientist (MLS) through ASCP. With 16 years of clinical laboratory experience spanning hematology, microbiology, and molecular diagnostics, she prepares candidates for ASCP board exams, MLT, MLS, and specialist certification tests.
Join the Discussion
Connect with other students preparing for this exam. Share tips, ask questions, and get advice from people who have been there.
View discussion (8 replies)