
Osteomyelitis MRI: Complete Guide to Imaging Findings, Protocols, Sequences, and Diagnostic Accuracy
Osteomyelitis MRI guide covering signal patterns, sequences, protocols, diagnostic accuracy, and how to distinguish acute from chronic bone infection. 🎯
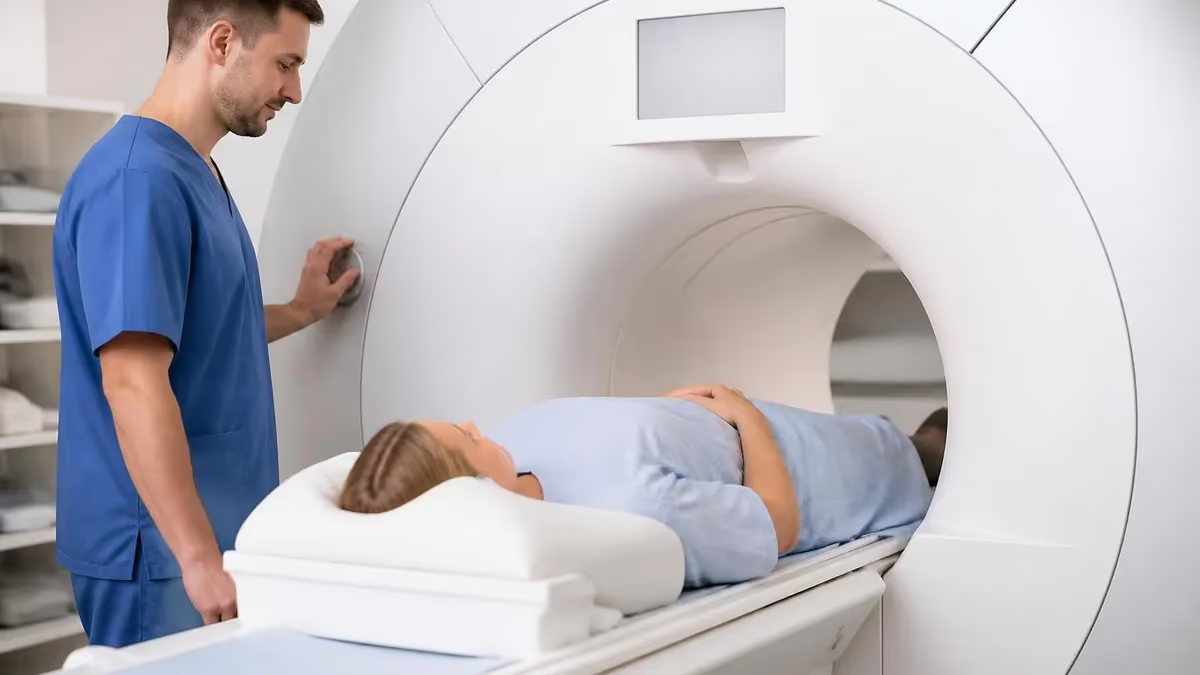
Osteomyelitis MRI is widely regarded as the single most sensitive imaging study for detecting bone and bone marrow infection, and it has become the cornerstone of diagnosis when clinicians suspect a deep musculoskeletal infection. Unlike radiographs, which may appear normal for ten to fourteen days after infection begins, magnetic resonance imaging reveals the earliest marrow changes within days. For technologists, radiologists, and registry candidates, understanding how osteomyelitis appears on MRI is essential because the modality detects edema, abscess, and cortical destruction long before structural collapse becomes visible on plain film.
The fundamental reason MRI excels at imaging osteomyelitis lies in its exquisite sensitivity to water content within the medullary cavity. Normal fatty marrow contains abundant lipid, producing bright signal on T1-weighted images. When infection floods the marrow space with inflammatory edema, pus, and cellular infiltrate, that fat signal is replaced by water-rich tissue. This swap creates the diagnostic hallmark of osteomyelitis: low signal on T1-weighted sequences and high signal on fluid-sensitive sequences such as T2 with fat suppression or STIR imaging.
Osteomyelitis can develop through three principal routes, and MRI helps distinguish among them. Hematogenous spread carries bacteria through the bloodstream and most often seeds the metaphysis of long bones in children or the vertebral bodies in adults. Contiguous spread occurs when infection extends from an adjacent soft-tissue source, such as a diabetic foot ulcer or a surgical wound. Direct inoculation follows penetrating trauma, open fractures, or orthopedic hardware placement. Each pathway leaves characteristic patterns the radiologist learns to recognize.
For diabetic patients in particular, MRI has transformed care because pedal osteomyelitis frequently hides beneath chronic ulcers and neuropathic changes. The ability to map the precise extent of marrow involvement directly guides surgical debridement margins and amputation level decisions. A scan that clearly delineates infected from viable bone can spare a patient unnecessary tissue loss, while one that underestimates spread risks recurrence. This high-stakes context explains why protocol accuracy and confident interpretation matter so profoundly in everyday clinical practice.
Beyond detection, MRI answers the questions that change management. Is there a drainable abscess requiring intervention? Has infection breached the cortex into surrounding muscle? Is a sinus tract connecting bone to skin? Does a sequestrum, the dead bone fragment characteristic of chronic disease, persist within the lesion? These structural details cannot be reliably obtained from radiographs, CT, or nuclear medicine alone, which is why MRI remains the reference standard for surgical planning and follow-up assessment.
This guide walks through every dimension of osteomyelitis MRI that students and practicing professionals need to master. We cover the optimal pulse-sequence protocol, the typical signal characteristics across acute and chronic disease, the role of gadolinium contrast, common diagnostic pitfalls such as the penumbra sign and reactive marrow edema, and the practical considerations that separate a diagnostic study from a nondiagnostic one. By the end you will understand not only what infection looks like but why it appears that way physically.
Osteomyelitis MRI by the Numbers

Standard Osteomyelitis MRI Protocol & Sequences
The workhorse sequence for marrow assessment. Normal fatty marrow appears bright; confluent low signal replacing that fat is the most specific sign of osteomyelitis and best defines the anatomic extent of disease.
Short tau inversion recovery or fat-suppressed T2 highlights edema and pus as bright signal. Highly sensitive but less specific, capturing inflammation, reactive edema, and surrounding cellulitis simultaneously.
Gadolinium-enhanced fat-suppressed T1 reveals enhancing inflamed marrow and, critically, non-enhancing abscess centers or devitalized bone. It separates drainable collections from solid phlegmon and guides intervention.
Axial, sagittal, and coronal planes ensure cortical breaches, sinus tracts, and soft-tissue extension are not missed. At least one fluid-sensitive and one T1 plane should cover the entire suspected region.
The signal characteristics of osteomyelitis flow directly from the underlying pathophysiology, and understanding the physics makes interpretation intuitive rather than memorized. As infection establishes itself, neutrophils, edema, and necrotic debris displace the fatty yellow marrow that normally fills the medullary cavity. Because fat protons relax quickly and produce high T1 signal, their replacement by water-dense inflammatory tissue causes the classic finding of geographic, confluent low T1 signal. This T1 marrow replacement is the most reliable single indicator of true bone infection.
On fluid-sensitive sequences such as STIR or fat-suppressed T2, the same pathologic water produces strikingly bright signal. Edema, abscess, and surrounding soft-tissue inflammation all light up, giving these sequences their outstanding sensitivity. The trade-off is reduced specificity, because trauma, recent surgery, neuropathic arthropathy, and even reactive marrow changes adjacent to degenerative joints can produce similar bright signal. The skilled reader therefore correlates the bright fluid-sensitive findings against the corresponding T1 images before committing to a diagnosis of infection.
Acute osteomyelitis tends to show ill-defined, diffuse marrow signal abnormality with surrounding edema, cortical hyperemia, and frequently an adjacent soft-tissue inflammatory reaction. Periosteal reaction may appear as a thin rim of fluid lifting the periosteum away from cortex. In children, the metaphyseal location near the growth plate is typical, while in adults the vertebral body and endplates are common targets. Recognizing the age-dependent distribution helps narrow the differential and direct attention to the correct anatomic compartment.
Chronic osteomyelitis presents a more complex picture that demands careful sequence comparison. Hallmarks include the sequestrum, a fragment of dead cortical bone that remains low signal on all sequences and fails to enhance, surrounded by granulation tissue. The involucrum, a shell of new periosteal bone, may encase the infected focus. A cloaca, or cortical opening, may connect the medullary infection to a draining sinus tract that MRI traces from bone to skin surface, information surgeons depend upon for planning.
Subacute osteomyelitis can organize into a Brodie abscess, a well-defined intramedullary lesion most often seen in the metaphysis of long bones in children and young adults. On MRI the Brodie abscess characteristically displays a central fluid cavity, a surrounding wall of granulation tissue that enhances avidly, and concentric layers of differing signal that produce the so-called target appearance. The penumbra sign, a thin rim of slightly T1-hyperintense granulation tissue lining the cavity, is a specific clue pointing toward infection over tumor.
Differentiating infection from reactive marrow edema is one of the most clinically important interpretive tasks. Pure reactive edema, such as that seen adjacent to a stress reaction or degenerative joint, typically remains bright on fluid-sensitive images but does not produce confluent, geographic T1 marrow replacement. When T1 signal stays relatively preserved and only fluid-sensitive sequences are abnormal, infection becomes far less likely. Anchoring the diagnosis to T1 morphology rather than fluid signal alone is the discipline that protects against overcalling osteomyelitis.
Field strength and coil selection also influence the quality of these signal assessments. Higher field strength magnets at 3 Tesla deliver superior signal-to-noise and finer spatial resolution for small structures such as the toes, while dedicated extremity coils improve uniformity of fat suppression. Inhomogeneous fat saturation, a frequent artifact at the curved surfaces of the foot and ankle, can mimic or obscure marrow edema, so technologists must optimize shimming and coil positioning before declaring a study diagnostic.
MRI Practice Test Questions
Prepare for the MRI - Magnetic Resonance Imaging exam with our free practice test modules. Each quiz covers key topics to help you pass on your first try.
MRI Knowledge
MRI Exam Questions covering Knowledge. Master MRI Test concepts for certification prep.
MRI Physics
Free MRI Practice Test featuring Physics. Improve your MRI Exam score with mock test prep.
MRI Anatomy and Pathology
MRI Test Prep for MRI Anatomy and Pathology. Practice MRI Quiz questions and boost your score.
MRI Anatomy and Positioning
MRI Questions and Answers on MRI Anatomy and Positioning. Free MRI practice for exam readiness.
MRI Contrast Agents
Free MRI Quiz on MRI Contrast Agents. MRI Exam prep questions with detailed explanations.
MRI Patient Care and Positioning
MRI Practice Questions for MRI Patient Care and Positioning. Build confidence for your MRI certification exam.
Contrast, T1, and T2 Imaging in Osteomyelitis MRI
T1-weighted spin echo is the cornerstone sequence for diagnosing osteomyelitis because it directly reflects the loss of fatty marrow. Healthy marrow appears bright due to its lipid content, so confluent, geographic regions of low T1 signal that replace this fat indicate true infection rather than mere reactive change. This morphology defines the precise extent of disease.
Radiologists rely on T1 to set surgical margins, because the boundary between low-signal infected marrow and bright normal marrow is usually sharp. Subtle or hazy reticulated low signal favors reactive edema instead of infection. When T1 marrow is preserved, osteomyelitis is statistically unlikely, making this sequence the anchor for confident, specific interpretation throughout the study.

MRI for Osteomyelitis: Strengths and Limitations
- +Highest sensitivity of any modality for early marrow infection
- +Detects disease 7-10 days before radiographic changes appear
- +Maps precise anatomic extent for surgical planning
- +Identifies drainable abscesses and sinus tracts with contrast
- +No ionizing radiation, safe for serial follow-up imaging
- +Superior soft-tissue contrast reveals associated cellulitis and collections
- −Reduced specificity from reactive edema and neuropathic mimics
- −Metal hardware artifact can obscure periprosthetic infection
- −Gadolinium may be contraindicated in severe renal impairment
- −Inhomogeneous fat suppression at curved surfaces causes artifact
- −Longer scan times and motion sensitivity than CT
- −Limited availability and higher cost in some clinical settings
Osteomyelitis MRI Interpretation Checklist
- ✓Confirm confluent low T1 signal replacing normal fatty marrow.
- ✓Verify corresponding high signal on STIR or fat-suppressed T2.
- ✓Assess fat suppression uniformity to exclude artifact mimicking edema.
- ✓Look for cortical destruction or breach on T1 and T2 images.
- ✓Identify any non-enhancing abscess cavity on post-contrast sequences.
- ✓Trace sinus tracts from the medullary cavity to the skin surface.
- ✓Search for sequestrum, involucrum, or cloaca in chronic disease.
- ✓Evaluate adjacent soft tissue for cellulitis and fluid collections.
- ✓Distinguish reactive edema from true marrow replacement on T1.
- ✓Correlate findings with clinical history, labs, and prior imaging.
Anchor every diagnosis to the T1 image
Confluent, geographic low signal replacing bright fatty marrow on T1-weighted images is the most specific MRI finding for osteomyelitis. Bright STIR signal alone is sensitive but nonspecific. When T1 marrow is preserved, true infection becomes far less likely regardless of how dramatic the fluid-sensitive images appear.
Even with excellent technique, osteomyelitis MRI is riddled with potential pitfalls, and recognizing common mimics is what separates an experienced reader from a novice. The most frequent error is overcalling infection based on bright fluid-sensitive signal without confirming T1 marrow replacement. Reactive edema from adjacent degenerative joints, recent trauma, stress reactions, and postoperative change can all generate dramatic STIR brightness while leaving the marrow fat largely intact on T1, a pattern that points away from true bone infection.
Neuropathic osteoarthropathy, especially the Charcot foot in diabetic patients, is perhaps the most challenging mimic of all. Charcot joints produce marrow edema, bone destruction, fragmentation, and enhancement that closely overlap with infection. Helpful discriminators include the distribution of disease, since Charcot favors the midfoot tarsometatarsal region while infection typically centers beneath a pressure ulcer at the toes, calcaneus, or malleoli. The presence of a skin ulcer, sinus tract, or soft-tissue abscess strongly tips the interpretation toward osteomyelitis.
The ghost sign offers a practical clue in the diabetic foot. When bone that appears poorly defined and low signal on T1 becomes sharper and more clearly delineated after contrast administration, infection is favored. In contrast, neuropathic disease tends to maintain reasonably preserved cortical and marrow signal. This dynamic relationship between pre- and post-contrast appearance has become a valuable tool when distinguishing the two conditions in clinically ambiguous feet.
The penumbra sign is a useful, relatively specific indicator of subacute osteomyelitis and Brodie abscess. It describes a thin rim of granulation tissue lining the abscess cavity that appears slightly hyperintense on unenhanced T1 images relative to the central fluid and surrounding sclerosis. Recognizing this subtle finding can steer the differential toward infection and away from neoplasms such as osteoid osteoma or even aggressive tumors that may otherwise enter the differential diagnosis.
Metal hardware presents both an obscuring artifact and a diagnostic opportunity. Susceptibility artifact from screws, plates, and prostheses can blur the very marrow the reader needs to assess, particularly in suspected periprosthetic joint infection. Metal artifact reduction sequences, increased bandwidth, and view-angle tilting techniques mitigate but do not eliminate this problem. When hardware degrades the study substantially, complementary imaging or image-guided aspiration may be required to reach a confident conclusion.
Finally, timing and treatment status influence interpretation. Marrow edema and enhancement can persist for weeks or months after infection has been adequately treated, so a follow-up scan showing residual signal abnormality does not necessarily indicate failed therapy. Postoperative marrow changes, fracture healing, and radiation effects further muddy the picture. The radiologist who integrates the clinical timeline, antibiotic history, and surgical record interprets these residual findings far more accurately than one reading the images in isolation.
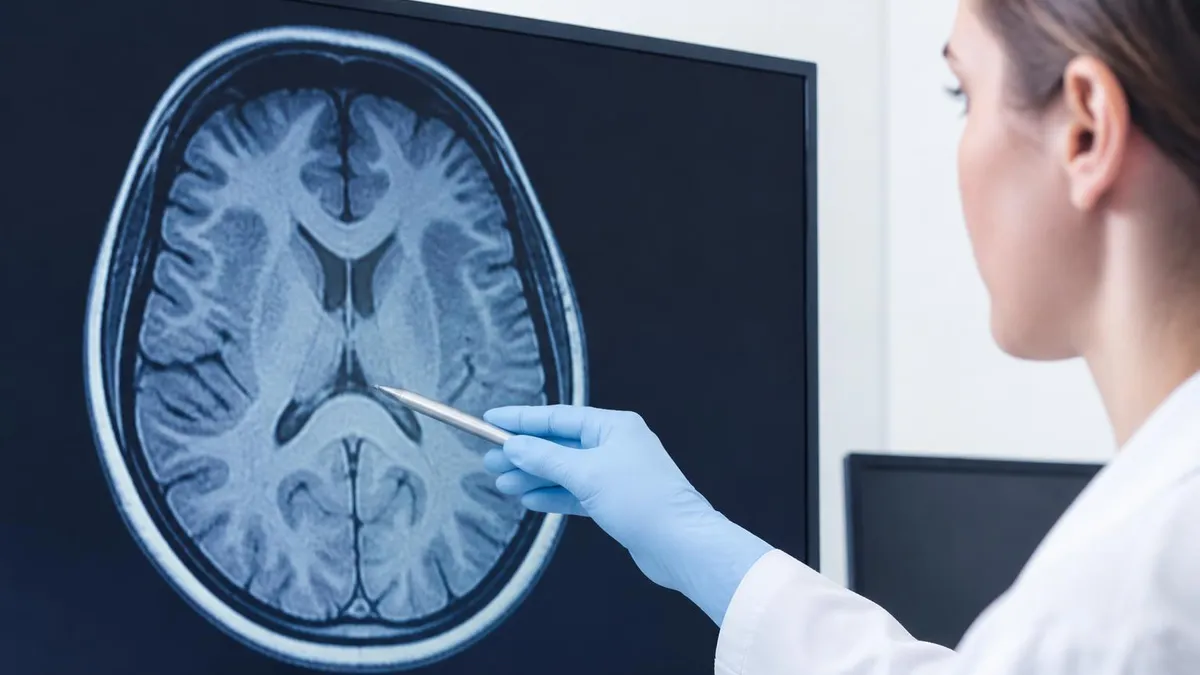
In the diabetic foot, neuropathic Charcot arthropathy and osteomyelitis can look nearly identical on MRI. Misclassifying one for the other risks either unnecessary amputation or untreated, progressive infection. Always integrate ulcer location, sinus tracts, the ghost sign, and clinical labs before committing to a diagnosis.
The diabetic foot is the clinical arena where osteomyelitis MRI delivers its greatest impact, because pedal infection is common, limb-threatening, and notoriously difficult to assess clinically. Beneath a chronic plantar or malleolar ulcer, infection can track silently into bone, and physical examination alone frequently underestimates its depth. MRI maps the precise extent of marrow involvement, the presence of soft-tissue abscess, and the integrity of the overlying skin, giving the surgical team the information they need to choose between conservative debridement and a defined level of amputation.
A dedicated diabetic foot protocol typically combines small field-of-view imaging with a dedicated extremity coil, T1 and STIR sequences in at least two planes, and contrast-enhanced fat-suppressed T1 when renal function permits. Sagittal and axial planes are essential for assessing the metatarsal heads, the calcaneus, and the malleoli, the pressure points where ulcers and underlying osteomyelitis cluster. Tracing the relationship between an ulcer and the nearest bone is often the decisive step in confirming contiguous spread of infection into the skeleton.
Vertebral osteomyelitis, also called spondylodiscitis, is the other major adult presentation, usually arising from hematogenous seeding of the vascular vertebral endplates. On MRI it produces low T1 and high STIR signal across two adjacent vertebral bodies with loss of the normal endplate definition and abnormal signal within the intervening disc. Contrast enhancement of the disc, endplates, and any paraspinal or epidural collection confirms the diagnosis and, critically, identifies epidural abscess that may threaten the spinal cord. Comprehensive spine evaluation is essential, and clinicians frequently combine such studies with imaging of the cervical spine when symptoms span multiple regions.
The destruction of the disc space is a key feature that distinguishes infectious spondylodiscitis from many noninfectious mimics. Degenerative endplate changes, particularly Modic type 1 changes, can resemble early infection, but they generally preserve the disc and lack the paraspinal soft-tissue mass and epidural extension that accompany true infection. The radiologist weighs the disc appearance, the pattern of endplate involvement, and the presence of associated collections to separate infection from degeneration with confidence.
In children, hematogenous osteomyelitis classically targets the metaphysis of rapidly growing long bones such as the distal femur and proximal tibia, where sluggish sinusoidal blood flow favors bacterial lodging. MRI in pediatric patients must balance image quality against scan time and the frequent need for sedation. Subperiosteal abscess, a collection lifting the periosteum from cortex, is a finding that often prompts urgent surgical drainage and is far better depicted on MRI than on any other modality available to the clinician.
Across all these scenarios, MRI also serves a vital role in monitoring treatment response and detecting complications. Serial scans can document resolving marrow edema, shrinking abscess cavities, and healing soft tissues, although residual signal abnormality may lag clinical improvement. New or enlarging collections, expanding cortical destruction, or progressive sinus tracts signal treatment failure and prompt escalation. Used thoughtfully alongside clinical and laboratory data, MRI guides the entire arc of care from initial diagnosis through definitive resolution of bone infection.
Producing a diagnostic osteomyelitis MRI study begins with disciplined technique, and several practical habits dramatically improve image quality. First, optimize fat suppression, because the curved surfaces of the foot and ankle frequently produce inhomogeneous chemical fat saturation that can mimic or hide marrow edema. Whenever uniform fat suppression cannot be achieved, STIR imaging provides a more reliable alternative since its fat nulling does not depend on field homogeneity. Confirming clean fat suppression before the patient leaves the magnet prevents nondiagnostic repeat studies.
Second, use the smallest field of view and an appropriate dedicated coil for the body part in question. A toe or forefoot examination demands far higher spatial resolution than a femur, and an extremity coil placed close to the anatomy delivers the signal-to-noise needed to resolve cortical breaches and small abscesses. Positioning the patient comfortably and immobilizing the limb reduces motion artifact, which is especially important in painful infected extremities where involuntary movement is common during longer acquisitions.
Third, always acquire both an anatomic T1 sequence and a fluid-sensitive sequence in matching planes so the reader can directly compare marrow morphology against edema distribution. The discipline of correlating bright STIR signal with the corresponding T1 image is the foundation of specific interpretation. When contrast is administered, fat-suppressed T1 before and after gadolinium allows confident identification of non-enhancing abscess and devitalized bone, the findings that most directly change surgical management.
For registry candidates and students preparing for board examinations, build a mental framework around the pathophysiology rather than rote memorization. Remember that fat is bright on T1, water is bright on fluid-sensitive sequences, and infection swaps fat for water. From that single principle the entire signal pattern of osteomyelitis follows logically: low T1, high STIR, and avid enhancement of perfused inflamed tissue. Anchoring your reasoning in physics makes exam questions far easier and mirrors how expert radiologists actually think at the workstation.
Practice recognizing the named signs that distinguish infection from its mimics. The penumbra sign suggests subacute infection, the ghost sign favors osteomyelitis over Charcot in the diabetic foot, and the presence of a sequestrum or sinus tract confirms chronic disease. Equally important is knowing the mimics cold: reactive edema, neuropathic arthropathy, degenerative Modic changes, and postoperative or fracture-related marrow signal. Exam writers love these distinctions because they reflect the real-world decisions that determine whether a patient receives antibiotics, surgery, or simply reassurance.
Finally, never interpret an osteomyelitis study in a vacuum. The single most powerful tool for improving diagnostic accuracy is integrating the clinical context: the duration of symptoms, inflammatory markers such as ESR and CRP, the presence of an overlying ulcer, prior surgery or hardware, and the patient's diabetic and vascular status. A scan that looks ambiguous in isolation often resolves into a confident diagnosis when these data are considered together. This integrated approach is the standard that distinguishes excellent radiologic practice from mere pattern matching.
As you continue developing expertise, review prior cases with surgical or microbiologic confirmation whenever possible, because correlating your MRI interpretation against the eventual diagnosis is the fastest route to calibration. Over time you will internalize which findings reliably predict infection and which lead to false positives. That feedback loop, combined with a firm grasp of the underlying physics and a structured interpretive checklist, builds the confident, accurate reading skills that osteomyelitis MRI demands in real clinical practice.
MRI Questions and Answers

MRI of Cervical Spine: Complete Guide to Imaging, Anatomy, Pathology, and Patient Preparation
MRI Medical Abbreviation: What MRI Stands For and Why It Matters
Knee MRI Images: A Complete Guide to Reading, Understanding, and Interpreting Knee Scans

ICD 10 Codes for MRI: Complete Guide to Abnormal MRI Coding, Documentation, and Reimbursement
Is Nickel Titanium MRI Compatible? A Complete Guide to MRI Safety Materials
Join the Discussion
Connect with other students preparing for this exam. Share tips, ask questions, and get advice from people who have been there.
View discussion (8 replies)