
Project Tracking Template Excel Free: The Complete 2026 September Guide to Building, Customizing, and Mastering Project Management Spreadsheets
❓ Download and build a project tracking template Excel free. Learn Gantt charts, formulas, dashboards, and automation for any project size in 2026 September.

Finding a reliable project tracking template Excel free of charge is one of the smartest moves a project manager, freelancer, or small business owner can make in 2026. While dedicated project management software like Asana, Monday.com, and ClickUp dominate the conversation, Microsoft Excel remains the most flexible, accessible, and universally understood platform for tracking tasks, deadlines, budgets, and team workloads. With nothing more than a free spreadsheet, you can build dashboards rivaling six-figure enterprise tools when you understand the right formulas and layout principles.
This comprehensive guide walks you through every component of a professional project tracking template — from basic task lists and Gantt charts to advanced automation using VLOOKUP, INDEX-MATCH, conditional formatting, and dynamic dropdown lists. Whether you manage a three-person marketing team or a 200-task construction project, the techniques covered here scale to fit any complexity level. Excel's grid structure is uniquely suited to project work because it lets you combine raw data, calculations, visualizations, and notes in a single file.
The biggest mistake new users make is downloading a template and using it as-is without customization. Every project has unique milestones, stakeholders, dependencies, and reporting needs. A truly effective tracker reflects your specific workflow, your client's communication style, and your team's reporting cadence. We'll show you how to start from a proven framework and then layer in features like RAG status indicators, percent-complete bars, automated due-date alerts, and pivot-table summaries.
You'll also learn how to avoid the classic Excel pitfalls that sink projects: broken formulas after row insertions, unprotected cells that team members accidentally overwrite, version-control chaos when files get emailed back and forth, and dashboards that look impressive but calculate nothing useful. By the end of this guide, you'll know exactly how to build a tracker that's resilient, scalable, and visually professional enough to share with executives.
This article assumes intermediate Excel familiarity — you know how to enter formulas, format cells, and navigate ribbons. If you're newer to spreadsheets, we'll point you toward foundational practice questions along the way. Veterans will find advanced sections on Power Query integration, dynamic array formulas in Excel 365, and conditional formatting techniques that transform static tables into live project dashboards.
Free templates are widely available from Microsoft, Smartsheet, Vertex42, and countless blogs, but quality varies dramatically. The best ones share four traits: clear column headers with no merged cells in data ranges, formulas that auto-extend with structured tables, separate input and output sheets, and a documentation tab explaining how everything works. Throughout this guide, we'll highlight these design principles so you can evaluate any template you download.
Let's dive in. By section three, you'll have a working framework. By the end, you'll have a complete blueprint for project tracking excellence that you can adapt to any industry, team size, or methodology — Agile, Waterfall, Kanban, or hybrid.
Excel Project Tracking by the Numbers

Core Building Blocks of a Project Tracking Template
The foundation tab where every task lives with columns for ID, name, owner, start date, due date, status, priority, and percent complete. Keep it as a structured table so formulas extend automatically.
A read-only summary view with KPI tiles, status charts, and milestone progress bars. Built from formulas referencing the task list, never manual entry. Stakeholders should never need to scroll raw data.
Lists team members, hourly rates, capacity, and current workload. Powers VLOOKUP formulas that pull names into dropdowns and calculate budget burn against actual hours logged per resource.
A timeline view showing major checkpoints, dependencies, and critical path. Built using conditional formatting on a date grid or stacked bar charts converted into Gantt visualizations.
Hidden helper tab containing all dropdown source lists — status options, priority levels, departments, phases. Centralizing these makes templates portable and easy to customize for new projects.
Once your template structure is in place, formulas are what transform it from a glorified spreadsheet into a live project management system. The single most important formula in any project tracker is VLOOKUP — or its modern replacement, XLOOKUP in Excel 365. VLOOKUP excel users rely on it to pull resource names, hourly rates, department codes, and task categories from reference sheets into your main task list. Without it, you'd be copy-pasting data manually every time something changes, which guarantees errors at scale.
The basic syntax is VLOOKUP(lookup_value, table_array, col_index, FALSE). The fourth argument should almost always be FALSE for exact match — approximate match causes silent miscalculations that haunt project budgets. Pair VLOOKUP with IFERROR to gracefully handle missing references: =IFERROR(VLOOKUP(B2,Resources!A:C,3,FALSE),"TBD"). This pattern alone will eliminate 80% of the #N/A errors that make trackers look amateur.
Status calculations are the next pillar. A typical formula for automatic RAG (Red-Amber-Green) status combines IF and TODAY: =IF(F2="Complete","Green",IF(E2 Percent complete tracking benefits from SUMIF and COUNTIF. To calculate the completion rate of an entire workstream, use =COUNTIFS(Phase,"Design",Status,"Complete")/COUNTIF(Phase,"Design"). Wrap it in IFERROR to handle the empty-phase divide-by-zero case. Display the result as a percentage, then build a stacked bar chart that updates automatically as team members mark tasks complete throughout the week.
Date math deserves its own discussion. NETWORKDAYS calculates business days between two dates, automatically excluding weekends — essential for accurate effort estimates. WORKDAY adds business days to a start date to project realistic end dates. EOMONTH finds the last day of any month, useful for monthly milestone reporting. EDATE shifts dates by month offsets, perfect for recurring deliverables. These four functions handle 90% of project-date calculations.
SUMPRODUCT is the secret weapon of advanced trackers. It can multiply hours times rates while filtering by status, owner, or phase in a single formula — replacing what would otherwise require pivot tables. Example: =SUMPRODUCT((Tasks[Owner]="Maria")*(Tasks[Status]<>"Cancelled")*Tasks[Hours]*Tasks[Rate]) returns Maria's billable total instantly. It's slower than SUMIFS on huge datasets but unmatched for complex weighted calculations.
Finally, dynamic array formulas in Excel 365 — FILTER, SORT, UNIQUE, and SEQUENCE — have revolutionized template design. A single FILTER formula can produce an overdue-tasks list, a my-tasks-this-week view, or a pivot-style summary without any pivot tables. These spill formulas keep dashboards fresh in real time, eliminating the manual refresh step that older Excel users grew up dreading.

Microsoft Excel Practice Test Questions
Prepare for the Microsoft Excel exam with our free practice test modules. Each quiz covers key topics to help you pass on your first try.
Microsoft Excel Excel Basic and Advance
Microsoft Excel Exam Questions covering Excel Basic and Advance. Master Microsoft Excel Test concepts for certification prep.
Microsoft Excel Excel Formulas
Free Microsoft Excel Practice Test featuring Excel Formulas. Improve your Microsoft Excel Exam score with mock test prep.
Microsoft Excel Excel Functions
Microsoft Excel Mock Exam on Excel Functions. Microsoft Excel Study Guide questions to pass on your first try.
Microsoft Excel Excel MCQ
Microsoft Excel Test Prep for Excel MCQ. Practice Microsoft Excel Quiz questions and boost your score.
Microsoft Excel Excel
Microsoft Excel Questions and Answers on Excel. Free Microsoft Excel practice for exam readiness.
Microsoft Excel Excel Trivia
Microsoft Excel Mock Test covering Excel Trivia. Online Microsoft Excel Test practice with instant feedback.
Microsoft Excel Advanced Data Analysis Tools
Free Microsoft Excel Quiz on Advanced Data Analysis Tools. Microsoft Excel Exam prep questions with detailed explanations.
Microsoft Excel Advanced Formula and Macro...
Microsoft Excel Practice Questions for Advanced Formula and Macro Creation. Build confidence for your Microsoft Excel certification exam.
Microsoft Excel Advanced Formulas and Macros
Microsoft Excel Test Online for Advanced Formulas and Macros. Free practice with instant results and feedback.
Microsoft Excel Basic and Advance Question...
Microsoft Excel Study Material on Basic and Advance Questions and Answers. Prepare effectively with real exam-style questions.
Microsoft Excel Creating and Managing Charts
Free Microsoft Excel Test covering Creating and Managing Charts. Practice and track your Microsoft Excel exam readiness.
Microsoft Excel Data Visualization with Ch...
Microsoft Excel Exam Questions covering Data Visualization with Charts. Master Microsoft Excel Test concepts for certification prep.
Microsoft Excel Formulas and Functions
Free Microsoft Excel Practice Test featuring Formulas and Functions. Improve your Microsoft Excel Exam score with mock test prep.
Microsoft Excel Formulas and Functions App...
Microsoft Excel Mock Exam on Formulas and Functions Application. Microsoft Excel Study Guide questions to pass on your first try.
Microsoft Excel Formulas Questions and Ans...
Microsoft Excel Test Prep for Formulas Questions and Answers. Practice Microsoft Excel Quiz questions and boost your score.
Microsoft Excel Functions Questions and An...
Microsoft Excel Questions and Answers on Functions Questions and Answers. Free Microsoft Excel practice for exam readiness.
Microsoft Excel Managing Data Cells and Ra...
Microsoft Excel Mock Test covering Managing Data Cells and Ranges. Online Microsoft Excel Test practice with instant feedback.
Microsoft Excel Managing Tables and Data
Free Microsoft Excel Quiz on Managing Tables and Data. Microsoft Excel Exam prep questions with detailed explanations.
Microsoft Excel Managing Tables and Table ...
Microsoft Excel Practice Questions for Managing Tables and Table Data. Build confidence for your Microsoft Excel certification exam.
Microsoft Excel Managing Worksheets and Wo...
Microsoft Excel Test Online for Managing Worksheets and Workbooks. Free practice with instant results and feedback.
Microsoft Excel MCQ Questions and Answers
Microsoft Excel Study Material on MCQ Questions and Answers. Prepare effectively with real exam-style questions.
Microsoft Excel Questions and Answers
Free Microsoft Excel Test covering Questions and Answers. Practice and track your Microsoft Excel exam readiness.
Mastering Visual Tools: How to Create a Drop Down List in Excel and Beyond
Learning how to create a drop down list in excel is non-negotiable for project trackers because it prevents data entry inconsistencies that break formulas. Open Data Validation from the Data ribbon, choose List, and reference your Settings tab range — for example, =Settings!$A$2:$A$10 for status options. Now every status cell offers a clean menu instead of free-text chaos.
For dependent dropdowns (where Department drives Team selection), use INDIRECT referencing named ranges. Create named ranges matching each department name, then set the team validation source to =INDIRECT(B2). When users pick Marketing in column B, column C automatically filters to only marketing team members. This single technique elevates a template from amateur to enterprise-grade.
Excel vs Dedicated Project Management Software: Which Wins?
- +Completely free with Microsoft 365 or Google Sheets equivalent
- +Universally familiar — no training required for stakeholders
- +Infinitely customizable for any methodology or industry
- +Works offline with no subscription or vendor lock-in
- +Powerful formulas, charts, and Power Query data connections built in
- +Easy to share via email, SharePoint, or OneDrive
- +Integrates with Power BI, Outlook, Teams, and the entire Microsoft stack
- −Manual version control unless stored on OneDrive or SharePoint
- −No native real-time collaboration like Asana or Monday.com
- −Mobile editing experience is cramped on small screens
- −Formulas break easily when rows are inserted or deleted improperly
- −No built-in time tracking, notifications, or automated reminders
- −Steep learning curve to build advanced dashboards from scratch
- −Limited audit trail compared to enterprise PM platforms
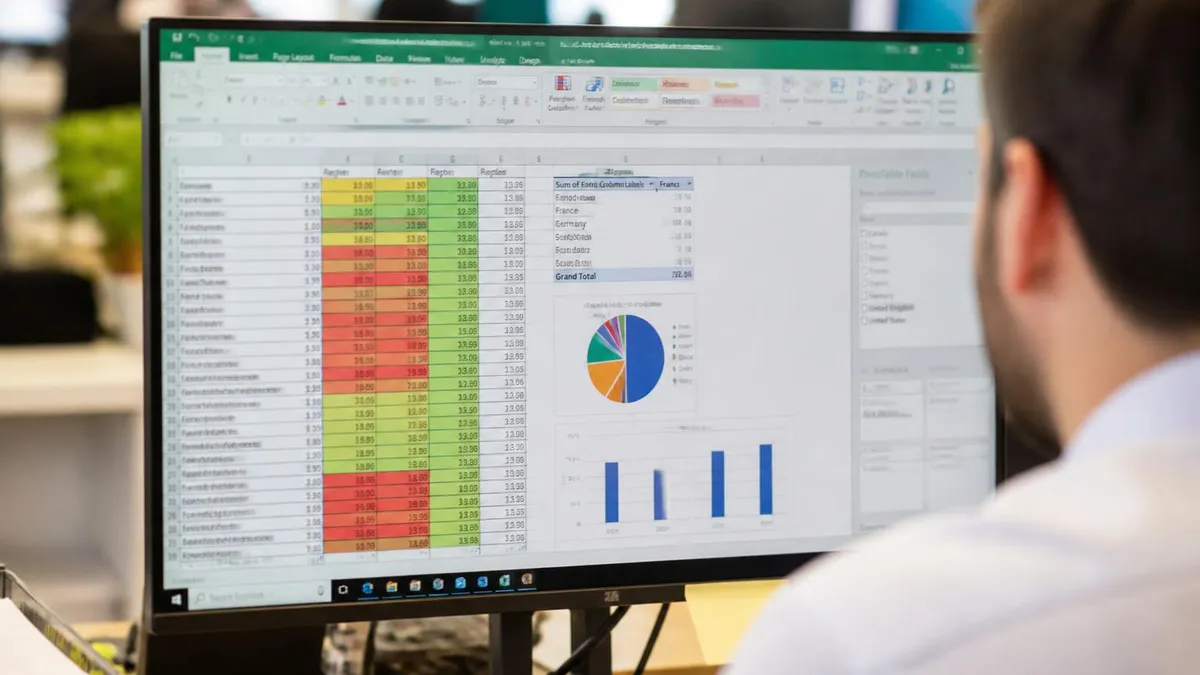
Project Tracking Template Excel Free Setup Checklist
- ✓Convert your task list into a structured table using Ctrl+T so formulas auto-extend with new rows.
- ✓Create a Settings tab holding all dropdown source lists for status, priority, phase, and department.
- ✓Apply Data Validation dropdowns to every column that should have controlled values.
- ✓Add IFERROR wrappers around every VLOOKUP and INDEX-MATCH formula in your template.
- ✓Build a Dashboard tab with KPI tiles, status pie chart, and milestone progress bars.
- ✓Apply conditional formatting for overdue tasks, RAG status, and percent-complete data bars.
- ✓Freeze the header row and ID column for easy scrolling through long task lists.
- ✓Protect formula cells and the Dashboard tab so users only edit input fields.
- ✓Add a Documentation tab explaining how the template works for future users.
- ✓Save a clean master copy as a .xltx template file before populating with project data.
Why Ctrl+T Changes Everything
Converting your data range to a structured table (Ctrl+T) is the single best decision you can make when building any project tracking template. Tables auto-extend formulas, banded rows improve readability, and structured references like Tasks[Status] make formulas self-documenting. Most template failures trace back to plain ranges that didn't grow with the data.
Even the most carefully built tracker can collapse under common pitfalls if you don't plan for them. The number one killer of project templates is broken references after row deletions. When a user deletes a task row, any formula referencing that specific row by absolute address — like =Tasks!$F$5 — turns into #REF!. The fix is to always use structured table references (Tasks[Status]) or named ranges, which adjust automatically as rows shift around throughout the project lifecycle.
Version control chaos is the second-biggest problem. When a tracker gets emailed around with names like project_tracker_FINAL_v3_REVISED.xlsx, conflicting edits become inevitable. Solve this by storing the master file on OneDrive, SharePoint, or Google Drive with co-authoring enabled. Excel 365 supports real-time collaboration just like Google Sheets, eliminating most version-control headaches when configured correctly with proper share permissions.
Unprotected cells are another silent killer. Without protection, users will inevitably type values directly into formula cells, overwriting calculations and breaking downstream dependencies. Select your input cells, open Format Cells, uncheck Locked under the Protection tab, then enable sheet protection under Review > Protect Sheet. Now only the cells you designated as inputs can be edited — formulas remain untouchable.
Date formatting inconsistencies cause subtle bugs. Some users type 5/22/2026, others type May 22 2026, and a few enter text that looks like a date but isn't. Force consistency with Data Validation set to Date type with reasonable min and max boundaries. Combine this with a custom number format like "yyyy-mm-dd" so dates always display in ISO format, which sorts correctly and reads clearly across regions.
Dropdown list breakage happens when source ranges move. If you reference =Settings!$A$2:$A$10 and someone inserts a row above the source, your validation still points to the old location. The fix is to define a Named Range (Formulas > Name Manager) like "StatusList" pointing to your source, then use =StatusList in validation. Named ranges follow the data automatically — a small habit with huge long-term payoff for template longevity.
Charts that don't update with new data are surprisingly common. The cause is usually a chart bound to a fixed range instead of a table. Recreate the chart from a structured table and it will expand automatically as rows are added. For dashboard-style summary charts, base them on formulas that aggregate the underlying table — that way both the underlying data and the visualization stay perfectly synchronized at all times.
Finally, watch out for circular references and volatile functions. Heavy use of NOW(), TODAY(), INDIRECT, and OFFSET can slow a tracker to a crawl on large datasets. Replace these with static dates where appropriate, use INDEX instead of OFFSET, and consider Power Query for any data transformation that runs more than a few times. A snappy template gets used; a slow one gets abandoned within weeks.
Never use merged cells inside the data section of your project tracker. They break sorting, filtering, pivot tables, and most formulas. Reserve merging exclusively for visual headers in dashboards. For centered titles inside data ranges, use Center Across Selection instead — it looks identical without the structural problems.
Advanced automation is where Excel project tracking transforms from a useful tool into a genuine competitive advantage. Power Query, accessible from the Data ribbon, lets you pull data from external sources like SharePoint lists, SQL databases, CSV exports, or even Outlook calendars into your tracker automatically. Once configured, a single refresh button pulls fresh data, applies your cleansing steps, and updates every downstream dashboard. This eliminates hours of manual copy-paste work every reporting cycle, especially for recurring weekly status reports.
Power Pivot extends Excel's data modeling capabilities by letting you build relationships between multiple tables — task lists, resources, time logs, budgets — without complex VLOOKUP chains. Combined with DAX measures, you can calculate sophisticated KPIs like schedule variance, cost performance index, and earned value across multiple projects simultaneously. For program managers tracking five or ten projects, Power Pivot is the difference between drowning in spreadsheets and gliding through portfolio reviews.
Macros and VBA remain powerful for automation when formulas alone aren't enough. A simple macro can email status reports to stakeholders, archive completed tasks to a history sheet, or generate weekly snapshots of project state automatically. Record macros to learn the syntax, then edit the generated code to add logic. Even non-programmers can build useful automations within a few hours of focused experimentation with the Visual Basic Editor.
Office Scripts, the cloud-based replacement for VBA in Excel for the web, opens up new automation possibilities through Power Automate flows. You can trigger script execution from a Teams message, a Forms submission, or a scheduled timer, then have results posted back to channels or emailed automatically. This server-side automation runs even when your laptop is closed, which is a genuine game-changer for distributed teams.
Dashboards reach their peak with slicers and timeline filters connected to pivot tables. Insert a pivot table from your task list, add slicers for owner, status, and phase, and your stakeholders can drill into any view interactively. Combine this with linked pivot charts and you have a Power BI-quality experience without leaving Excel. Slicers also work directly on structured tables in Excel 365, giving you interactive filtering without needing pivot tables at all.
Sparklines deserve mention as the most underrated visualization in Excel. These tiny in-cell charts show trends over time per row — perfect for showing each task's daily progress history at a glance. Insert from the Insert ribbon, pick line, column, or win-loss style, and reference the date columns. The result is a polished dashboard element that takes thirty seconds to create and looks remarkably professional in executive reports.
Finally, integrate your tracker with Microsoft Teams for live notifications. Power Automate can monitor your spreadsheet for status changes and post updates to a Teams channel automatically. Stakeholders stay informed without ever opening the file, and the audit trail of changes is captured in chat history. This bridges the gap between Excel's flexibility and the real-time collaboration features of dedicated PM platforms quite elegantly.
Bringing everything together, the final step is making your project tracking template Excel free for your team to actually adopt. The best technical template fails if it sits unused. Start with a kickoff session where you walk team members through the input columns, dropdown choices, and status update rhythm. Recording a five-minute screencast embedded in the Documentation tab dramatically increases adoption rates because new joiners can self-onboard without scheduling time with you.
Establish a clear update cadence. Most teams thrive on a Monday-morning status refresh where everyone updates their own rows before the weekly project meeting. Pair this with automated reminder emails sent via Power Automate, and you eliminate the chasing-for-updates dance that drains project managers. The discipline of consistent updates matters more than the sophistication of your formulas in most cases.
Customize the template for your industry. Construction projects need columns for permits, inspections, and weather delays. Marketing campaigns need creative review stages and asset approval workflows. Software projects need sprint numbers, story points, and bug severity. Add three to five industry-specific columns rather than forcing your team into a generic framework that doesn't fit your actual work patterns. The closer the template mirrors your real workflow, the higher the engagement.
Build in a retrospective tab where you capture lessons learned, scope changes, and decisions. This historical record becomes invaluable for future planning — you'll start each new project with a library of estimates, risks, and patterns from past work. Many project managers underestimate how much institutional knowledge is locked in their heads and never captured in any system. The retrospective tab solves this with almost zero overhead.
Train your team on the basics they'll actually use: filtering, sorting, freezing rows, and updating their assigned tasks. You don't need to teach VLOOKUP or pivot tables to everyone — those are PM-level skills. But everyone should know how to filter to their own tasks, change a status, and read the dashboard. Twenty minutes of training upfront prevents weeks of confusion and broken cells later in the project lifecycle.
Review your template after every project completion. What worked? What columns were ignored? What manual reports did you keep building outside the tracker? These signals tell you what to add, remove, or restructure for the next version. Treat your template as a living product that improves over time, not a static document. The teams with the best trackers are the ones who iterate on them ruthlessly based on real usage feedback.
And finally, share your template with the broader community when it's polished. Posting a clean version to your blog, LinkedIn, or a forum like Reddit's r/excel positions you as an expert and often generates valuable feedback that improves your work. Many widely used Excel templates started as one person's working document — yours could be next. The path from personal productivity tool to industry-standard resource is shorter than most people realize.
Excel Questions and Answers

Excel Functions List: The Complete Reference Guide to Every Formula You Need in 2026

Excel Finance Functions Guide With PMT, NPV, IRR and Loan Models

Standard Deviation Formula in Excel: STDEV.P vs STDEV.S Guide

Excel Data Analysis Toolpak: Complete Guide to the Analysis ToolPak Add-In

How to Create a Report in Excel: The Complete 2026 Guide to Building Professional Spreadsheet Reports
About the Author

Business Consultant & Professional Certification Advisor
Wharton School, University of PennsylvaniaKatherine Lee earned her MBA from the Wharton School at the University of Pennsylvania and holds CPA, PHR, and PMP certifications. With a background spanning corporate finance, human resources, and project management, she has coached professionals preparing for CPA, CMA, PHR/SPHR, PMP, and financial services licensing exams.