EEG Frequency Bands: Understanding Delta, Theta, Alpha, Beta, and Gamma Brain Waves
🟢 Learn about EEG frequency bands — delta, theta, alpha, beta, and gamma. Understand what each brain wave means on an EEG test and how they aid diagnosis.
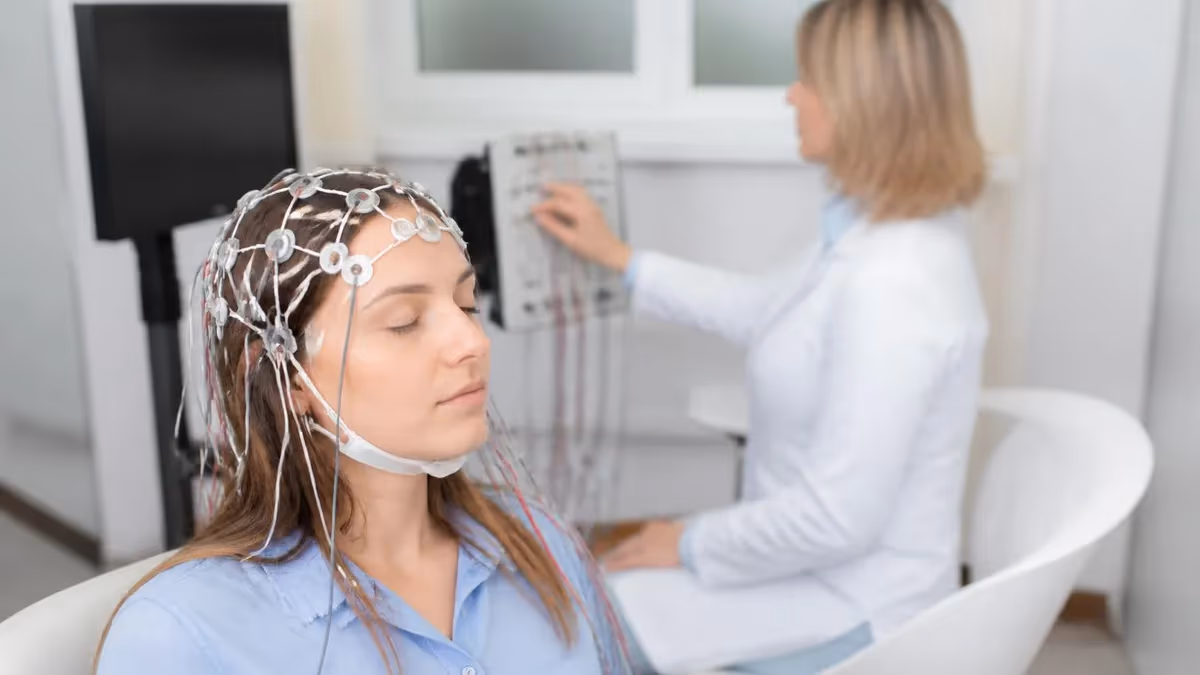
Understanding EEG frequency bands is fundamental to interpreting brain wave activity during an EEG test. When electrodes are placed on the scalp, the electroencephalogram captures electrical signals produced by millions of neurons firing in synchronized patterns. These signals are categorized into distinct frequency bands, each associated with specific brain states, cognitive processes, and clinical conditions. Whether you are a neurology student, an EEG technologist preparing for certification, or a patient curious about your results, grasping these categories helps demystify the data clinicians rely on every day.
The concept of EEG frequency bands dates back to the 1920s when Hans Berger first recorded human brain waves and identified alpha waves as the dominant rhythm in a relaxed, awake individual with closed eyes. Since then researchers have mapped additional frequency ranges, revealing a spectrum that extends from the slow delta waves seen during deep sleep to the rapid gamma oscillations linked to higher cognitive functions. Each band occupies a specific hertz range, and deviations from normal patterns can signal neurological disorders warranting further investigation.
An EEG medical test measures voltage fluctuations along the scalp surface using standardized electrode placements, most commonly the international 10-20 system. The raw signal is a composite of all active frequency bands, and digital filtering separates these components for analysis. Modern EEG equipment displays each band in real time, allowing technologists to observe transitions between wakefulness, drowsiness, and sleep stages. This dynamic view of brain electrical activity makes the EEG an indispensable tool in clinical neuroscience and diagnostic medicine across hospitals worldwide.
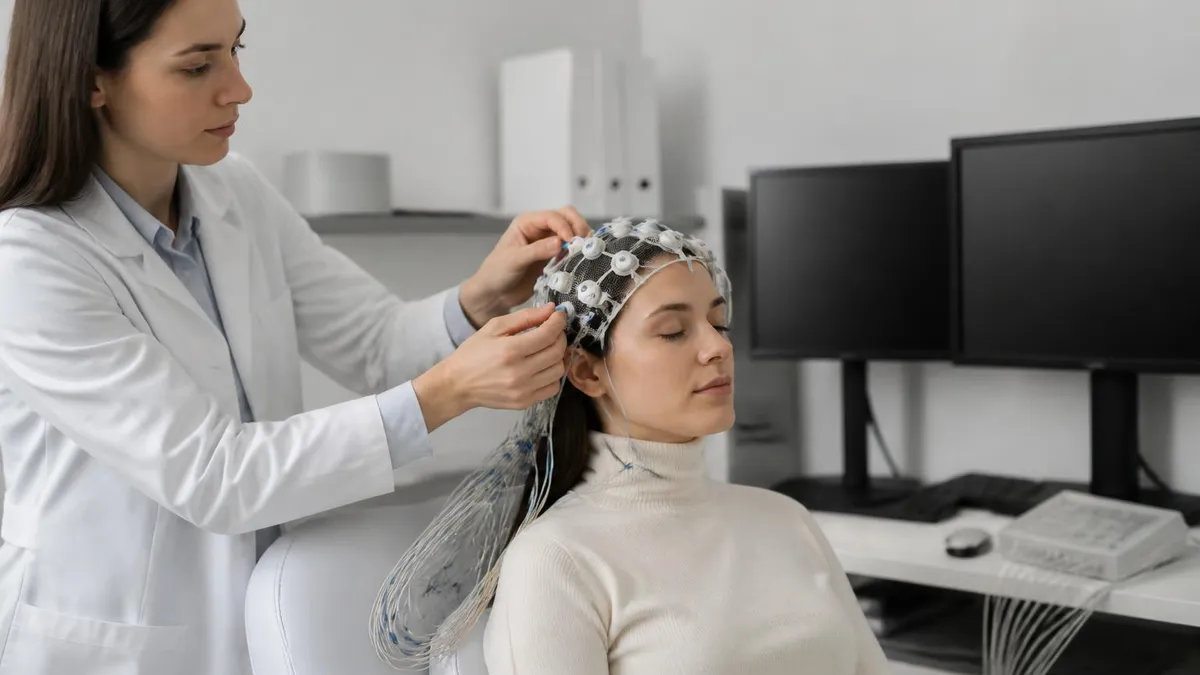
Many patients ask what is an EEG test before their appointment, and the answer often begins with frequency bands. Clinicians explain that the procedure is painless and noninvasive, involving small sensors attached to the scalp with conductive paste. The recording session typically lasts between twenty and forty minutes for a routine study, though extended monitoring can span hours or days. Understanding that the test sorts brain signals into frequency categories helps patients appreciate why activities like closing their eyes or hyperventilating are requested during the procedure.
Amplitude and frequency are the two primary measurements taken from an EEG waveform. Frequency, measured in hertz, describes how many complete wave cycles occur per second. Amplitude, measured in microvolts, indicates the strength of the electrical signal. A healthy brain produces predictable combinations of these values depending on age, level of alertness, and whether the person is performing a cognitive task. Abnormal combinations often prompt further investigation, including advanced neuroimaging or prolonged monitoring sessions to clarify the clinical picture.
Concerns about eeg test side effects are common, but the procedure carries virtually no risk. The electrodes only record activity and do not deliver any electrical current to the brain. Mild skin irritation from the adhesive paste is the most frequently reported discomfort, resolving quickly after sensor removal. Knowing that the test is safe allows patients to relax, which produces cleaner recordings because muscle tension creates artifacts that can obscure the very frequency bands clinicians need to evaluate during the study.
In the sections that follow you will learn about each of the five primary EEG frequency bands, their clinical significance, and how technologists use them in daily practice. We will also explore factors that influence frequency band presentation, common artifacts that mimic brain wave patterns, and the role these bands play in diagnosing conditions from epilepsy to sleep disorders. This overview serves as both a study resource and a practical reference for anyone involved in electroencephalography interpretation or patient care.
EEG Frequency Bands by the Numbers

The Five Primary EEG Frequency Bands
The slowest brain waves with the highest amplitude. Delta dominates during deep stage N3 sleep in healthy adults. Abnormal delta during wakefulness may indicate structural lesions, metabolic encephalopathy, or diffuse cerebral dysfunction.
Prominent during drowsiness, light sleep, and early childhood. Theta is normal during sleep transitions in adults but excessive waking theta can suggest focal cerebral pathology or generalized dysfunction requiring clinical evaluation.
The posterior dominant rhythm in relaxed, awake individuals with eyes closed. Alpha waves react to eye opening and serve as the benchmark for assessing normal brain function. Asymmetry may indicate hemispheric pathology.
Fast, low-amplitude activity associated with alertness, active thinking, and concentration. Beta is prominent over frontal regions. Medications like benzodiazepines enhance beta, creating a characteristic diffuse fast pattern on recordings.
The fastest oscillations linked to higher cognitive processing, sensory binding, and memory. Scalp EEG has limited gamma sensitivity, but intracranial recordings reveal rich gamma activity valuable for presurgical epilepsy planning.
Clinical applications of EEG frequency band analysis extend far beyond simple brain wave monitoring. Neurologists rely on frequency band data to diagnose epilepsy, evaluate sleep disorders, monitor patients under anesthesia, and assess brain injuries from trauma or stroke. Each clinical scenario presents a unique combination of frequency band changes. Focal slowing in the delta or theta range over one hemisphere may indicate a structural lesion, while generalized high-amplitude delta activity in an awake adult can suggest metabolic encephalopathy or diffuse cerebral dysfunction.
Epilepsy diagnosis represents one of the most critical uses of frequency band analysis during an EEG test. Seizures produce characteristic changes in frequency and amplitude that vary by seizure type. Generalized tonic-clonic seizures typically begin with low-voltage fast activity in the beta range before transitioning to rhythmic spike-and-wave discharges. Absence seizures show the classic three-hertz spike-and-wave pattern, a hallmark that differentiates them from complex partial seizures. Many patients wonder how long is an eeg test when ordered to capture seizure activity.
Sleep medicine relies heavily on EEG frequency bands to stage sleep architecture. During polysomnography, technologists identify sleep stages by observing transitions between bands. Stage N1 drowsiness shows theta predominance, while stage N2 features sleep spindles in the sigma range between twelve and fourteen hertz along with K-complexes. Stage N3 is defined by high-amplitude delta waves occupying at least twenty percent of a thirty-second epoch. These distinctions are essential for diagnosing conditions like narcolepsy, obstructive sleep apnea, and periodic limb movement disorder.
Intraoperative neurophysiological monitoring uses real-time EEG frequency band analysis to protect the brain during surgery. Anesthesiologists track alpha and beta activity to gauge anesthetic depth, ensuring adequate sedation without dangerously deep suppression. A sudden shift from normal patterns to burst suppression or electrocerebral silence alerts the surgical team to potential ischemia or overdose. This application has become standard practice for high-risk surgeries involving the brain, spine, or major blood vessels where cerebral perfusion must be continuously verified.
Neurocritical care units use continuous EEG to detect subclinical seizures and assess injury severity. Patients with traumatic brain injury, subarachnoid hemorrhage, or post-cardiac arrest encephalopathy undergo prolonged monitoring lasting twenty-four to seventy-two hours. Quantitative EEG techniques display frequency band trends as color-coded spectrograms, allowing clinicians to identify seizure patterns and track background activity over extended periods. Compressing hours of data into visual format makes frequency band analysis invaluable in critical care settings where rapid decisions save lives.
Research applications have expanded dramatically with brain-computer interface technology advances. Scientists use specific frequency bands to decode user intentions, enabling paralyzed individuals to control computer cursors and communication devices through thought. Motor imagery tasks produce measurable changes in the mu rhythm, a subset of alpha localized over the sensorimotor cortex. Beta desynchronization during movement planning and gamma synchronization during cognitive processing provide additional control signals that researchers are actively refining for clinical brain-computer interface applications across rehabilitation centers.
Psychiatric applications are gaining traction as researchers discover consistent EEG biomarkers for depression, anxiety, ADHD, and schizophrenia. Frontal alpha asymmetry has been associated with depression and emotional regulation difficulties. Excessive frontal theta has been linked to attention deficits, while reduced gamma coherence may reflect disrupted cognitive integration in schizophrenia. Neurofeedback therapy, which trains patients to modify their own frequency band patterns, is emerging as a complementary treatment approach for these conditions with growing clinical evidence supporting its effectiveness.
EEG Practice Test Questions
Prepare for the EEG - Electroencephalography exam with our free practice test modules. Each quiz covers key topics to help you pass on your first try.
EEG Abnormal Epileptiform Patterns
EEG Exam Questions covering Abnormal Epileptiform Patterns. Master EEG Test concepts for certification prep.
EEG Activation Procedures
Free EEG Practice Test featuring Activation Procedures. Improve your EEG Exam score with mock test prep.
EEG Artifact Identification
EEG Test Prep for Artifact Identification. Practice EEG Quiz questions and boost your score.
EEG Electrode Placement and Montages
EEG Questions and Answers on Electrode Placement and Montages. Free EEG practice for exam readiness.
EEG - Electroencephalography Abnormal Epil...
EEG Mock Test covering - Electroencephalography Abnormal Epileptiform Patterns. Online EEG Test practice with instant feedback.
EEG - Electroencephalography Activation Pr...
Free EEG Quiz on - Electroencephalography Activation Procedures. EEG Exam prep questions with detailed explanations.
EEG - Electroencephalography Artifact Iden...
EEG Practice Questions for - Electroencephalography Artifact Identification. Build confidence for your EEG certification exam.
EEG - Electroencephalography Electrode Pla...
EEG Test Online for - Electroencephalography Electrode Placement and Montages. Free practice with instant results and feedback.
EEG - Electroencephalography Instrumentati...
EEG Study Material on - Electroencephalography Instrumentation and Calibration. Prepare effectively with real exam-style questions.
EEG - Electroencephalography Neuroanatomy ...
Free EEG Test covering - Electroencephalography Neuroanatomy and Physiology. Practice and track your EEG exam readiness.
EEG - Electroencephalography Non-Epileptif...
EEG Exam Questions covering - Electroencephalography Non-Epileptiform Abnormalities. Master EEG Test concepts for certification prep.
EEG - Electroencephalography Normal EEG Wa...
Free EEG Practice Test featuring - Electroencephalography Normal EEG Waveforms. Improve your EEG Exam score with mock test prep.
EEG - Electroencephalography Patient Safet...
EEG Mock Exam on - Electroencephalography Patient Safety and Ethics. EEG Study Guide questions to pass on your first try.
EEG - Electroencephalography Pediatric and...
EEG Test Prep for - Electroencephalography Pediatric and Neonatal EEG. Practice EEG Quiz questions and boost your score.
EEG ICU and Continuous EEG Monitoring
EEG Questions and Answers on ICU and Continuous EEG Monitoring. Free EEG practice for exam readiness.
EEG Instrumentation and Calibration
EEG Mock Test covering Instrumentation and Calibration. Online EEG Test practice with instant feedback.
EEG Neuroanatomy and Physiology
Free EEG Quiz on Neuroanatomy and Physiology. EEG Exam prep questions with detailed explanations.
EEG Non-Epileptiform Abnormalities
EEG Practice Questions for Non-Epileptiform Abnormalities. Build confidence for your EEG certification exam.
EEG Normal EEG Waveforms
EEG Test Online for Normal EEG Waveforms. Free practice with instant results and feedback.
EEG Patient Safety and Ethics
EEG Study Material on Patient Safety and Ethics. Prepare effectively with real exam-style questions.
What Is an EEG Test: Types and Frequency Analysis Methods
A routine EEG test is the most common electroencephalogram performed in clinical settings, lasting twenty to forty minutes while capturing brain wave activity across all major frequency bands. Technologists apply electrodes using the international 10-20 system and instruct the patient to rest with eyes closed and open. Activation procedures such as hyperventilation and photic stimulation provoke abnormal frequency band responses that might not appear during baseline recording, increasing the diagnostic yield of this relatively brief clinical study.
During the routine EEG, the technologist establishes the patient's dominant posterior rhythm, typically in the alpha range for healthy adults. Any asymmetry in frequency or amplitude between hemispheres is noted for the interpreting neurologist. Focal slowing, excessive medication-related beta activity, or intermittent rhythmic delta activity require careful documentation. The routine study provides a valuable snapshot of brain electrical function that guides further diagnostic decisions and determines whether extended monitoring is clinically warranted for the individual patient.

Advantages and Limitations of EEG Frequency Band Analysis
- +Noninvasive and painless with no radiation exposure, safe for repeated testing in all age groups including neonates and pregnant women
- +Excellent millisecond-level temporal resolution captures rapid brain electrical changes that MRI and CT cannot detect
- +Real-time monitoring enables immediate clinical decisions during surgery, critical care, and active seizure management
- +Cost-effective compared to advanced neuroimaging, with routine EEGs available at most hospitals and outpatient clinics
- +Portable ambulatory systems enable extended home monitoring, increasing diagnostic yield for intermittent conditions
- +Quantitative EEG software provides objective spectral analysis and automated seizure detection enhancing clinical interpretation
- −Limited spatial resolution because scalp electrodes sample activity from large cortical areas rather than precise anatomical structures
- −Scalp recordings attenuate high-frequency gamma signals and miss activity from deep structures like the hippocampus
- −Susceptible to muscle, eye movement, and environmental artifacts that can obscure true brain wave frequency patterns
- −A single routine EEG may miss intermittent abnormalities, with false-negative rates reaching fifty percent in epilepsy cases
- −Interpretation requires extensive training and remains somewhat subjective with documented inter-reader variability
- −Normal findings do not rule out neurological disease, as many confirmed epilepsy patients have normal interictal recordings
EEG Frequency Band Interpretation Checklist
- ✓Identify the posterior dominant rhythm and confirm it falls within the normal alpha range for the patient's age.
- ✓Assess symmetry of frequency and amplitude between hemispheres across all corresponding electrode pairs.
- ✓Check alpha rhythm reactivity to eye opening and confirm appropriate attenuation occurs bilaterally.
- ✓Evaluate the anterior-to-posterior frequency gradient to ensure faster frequencies predominate frontally.
- ✓Document any focal slowing in the delta or theta range and note the precise scalp region involved.
- ✓Screen for epileptiform discharges including spikes, sharp waves, and spike-and-wave complexes across all montages.
- ✓Review the hyperventilation response for buildup of generalized rhythmic delta activity or focal changes.
- ✓Assess photic stimulation responses including driving and photoparoxysmal discharges at each flash frequency.
- ✓Identify medication effects such as diffuse beta enhancement from benzodiazepines or slowing from sedatives.
- ✓Document all artifacts and confirm they have been distinguished from true cerebral frequency band activity.
The Posterior Dominant Rhythm Is Your Starting Point
Every systematic EEG interpretation should begin with identifying the posterior dominant rhythm. This alpha-range rhythm, typically 8 to 13 Hz in adults, serves as the benchmark for assessing overall brain function. If it is absent, asymmetric, or slowed below age-appropriate norms, it signals potential pathology requiring investigation before evaluating any other findings. Training yourself to assess this rhythm first creates a reliable framework for comprehensive frequency band analysis.
EEG frequency bands undergo predictable changes across the human lifespan, making age one of the most important factors in accurate interpretation. Neonatal EEG patterns look dramatically different from adult recordings, and failing to account for age-related norms leads to misdiagnosis. In premature infants the EEG shows discontinuous patterns with high-amplitude mixed-frequency bursts alternating with relative quiescence. As gestational age increases, these patterns become more continuous and organized, reflecting rapid maturation of cortical neural networks during the first weeks of extrauterine life.
During the first year, the dominant posterior rhythm emerges and gradually increases in frequency. At three months the posterior rhythm typically runs at three to four hertz within the theta range. By twelve months it accelerates to about six hertz, continuing to increase throughout childhood and reaching the adult alpha range of eight to thirteen hertz by approximately age eight to ten. This developmental trajectory means a six-hertz posterior rhythm that would be abnormal in an adult is perfectly normal for a two-year-old, illustrating why age context is essential.
Adolescence and early adulthood represent peak EEG organization, with well-formed alpha rhythms, clear anterior-to-posterior frequency gradients, and predictable reactivity to eye opening. Beta activity is prominent frontally, and theta is minimal during relaxed wakefulness. This mature pattern serves as the standard against which all other age groups are compared. Any persistent focal or generalized slowing in a healthy young adult warrants investigation, as it suggests underlying pathology rather than normal developmental variation in frequency band distribution.
Normal aging introduces subtle but measurable changes in frequency band distribution. Research shows gradual posterior dominant rhythm slowing with advancing age, though it typically remains within the alpha range throughout a healthy lifespan. Alpha amplitude may decrease, and intermittent temporal theta becomes more common in elderly individuals without cognitive impairment. These benign changes, sometimes called temporal slowing of the elderly, must be distinguished from the pronounced persistent slowing associated with neurodegenerative diseases such as Alzheimer disease or vascular dementia.
Neurodegenerative diseases produce characteristic EEG frequency band alterations correlating with disease severity. Alzheimer disease typically shows progressive posterior dominant rhythm slowing from alpha into theta, with increased generalized theta and delta activity. Frontotemporal dementia may preserve alpha rhythms early, distinguishing it from Alzheimer patterns. Lewy body dementia often produces prominent posterior slow-wave activity and fluctuating patterns mirroring clinical fluctuations in attention. These disease-specific signatures make EEG a valuable supplementary diagnostic tool when combined with neuroimaging and cognitive testing results.
Medications significantly influence frequency band presentation and must always be considered during interpretation. Benzodiazepines and barbiturates enhance beta activity, producing diffuse fast activity that can obscure pathology. Antiepileptic medications may normalize previously abnormal patterns, complicating seizure risk assessment during dose adjustments. Opioids and sedatives increase delta and theta activity, potentially mimicking encephalopathy. A thorough medication history is essential before meaningful interpretation can begin, and technologists should document all current medications directly on the recording for the interpreting physician.
Metabolic disturbances alter EEG frequency bands in predictable ways that experienced interpreters recognize immediately. Hepatic encephalopathy produces triphasic waves with characteristic morphology evolving as liver dysfunction worsens. Uremic encephalopathy and electrolyte imbalances cause diffuse slowing and potentially burst suppression in severe cases. Hypoglycemia initially increases beta activity before progressing to diffuse slowing as glucose drops further. Recognizing these metabolic patterns helps clinicians address the underlying cause rather than treating the EEG abnormality in isolation, ultimately improving patient outcomes through targeted intervention.

Always interpret EEG frequency bands in clinical context including the patient's age, alertness level, medications, and history. Generalized theta is expected during drowsiness, diffuse beta enhancement is a predictable benzodiazepine effect, and temporal theta slowing is benign in elderly patients. Context-free interpretation leads to overcalling abnormalities and unnecessary clinical interventions that increase patient anxiety and healthcare costs.
The EEG test price varies considerably depending on study type, clinical setting, and geographic location within the United States. A routine outpatient EEG typically costs between two hundred and six hundred dollars without insurance, while a twenty-four-hour ambulatory study ranges from seven hundred to fifteen hundred dollars. Hospital-based video EEG monitoring involving multi-day admission can cost three thousand to ten thousand dollars or more. Understanding the eeg test cost structure helps patients plan financially and explore insurance coverage before scheduling their study.
Insurance coverage for EEG testing is generally favorable when medically indicated. Most commercial plans, Medicare, and Medicaid cover EEG tests ordered to evaluate seizures, altered mental status, or neurological complaints. Prior authorization may be required for extended monitoring, and patients should verify coverage beforehand. Out-of-pocket costs for insured patients typically include copays or coinsurance percentages varying by plan. Uninsured patients should ask about self-pay discounts, as many facilities offer reduced rates that can lower the effective EEG test price substantially.
Preparation for an EEG test is straightforward but important for high-quality recordings accurately representing frequency band activity. Patients should wash their hair the night before and avoid conditioners, hairsprays, or oils that interfere with electrode adhesion. Caffeine intake should be limited on test day because it alters beta activity patterns. Some physicians request sleep deprivation before the study to increase the likelihood of capturing abnormalities during drowsiness and sleep transitions that might reveal epileptiform discharges not seen during alert wakefulness.
What is an EEG test in terms of duration? It depends entirely on the clinical question and study type ordered. Routine EEGs take twenty to forty minutes of recording time plus fifteen to thirty minutes for electrode application and removal. Extended routine studies may last sixty to ninety minutes to capture sleep-onset transitions. Ambulatory recordings run continuously for twenty-four to seventy-two hours, and inpatient video monitoring can extend from three to fourteen days depending on how quickly diagnostic data is obtained from frequency band analysis.
After recording, a board-certified neurologist reviews the entire study analyzing background frequency, symmetry, reactivity, and abnormal waveforms. The report describes the dominant posterior rhythm and its frequency, any focal or generalized slowing, epileptiform discharges if present, and activation procedure effects. Frequency band analysis forms the backbone of interpretation, with deviations from age-appropriate norms driving clinical decisions. Patients typically receive results within one to five business days, though urgent findings are communicated immediately to the ordering physician for rapid intervention.
A normal EEG result indicates all frequency bands fall within expected ranges for the patient's age and alertness level. An abnormal result may reveal focal slowing suggesting structural pathology, generalized slowing indicating encephalopathy, or epileptiform discharges pointing toward seizure disorder. The interpreting physician considers findings alongside clinical history, neurological examination, and previous imaging. Professionals who want to understand what is a eeg test from a career perspective should know that mastering frequency band interpretation is a core competency for certification.
Follow-up after an EEG depends on initial findings and clinical context. A normal routine EEG in a patient with suspected seizures may prompt ambulatory or video monitoring to increase sensitivity. Abnormal epileptiform activity typically leads to antiepileptic medication initiation or adjustment. Findings suggesting structural pathology usually trigger brain MRI referral. Understanding how frequency band analysis guides these clinical pathways empowers patients to engage meaningfully with their healthcare providers about diagnostic next steps and treatment planning for their neurological condition.
Mastering EEG frequency band recognition requires consistent practice with real clinical recordings and a systematic approach to pattern identification. Whether you are preparing for board examinations or refining your clinical skills, the most effective strategy combines structured study with hands-on experience reviewing actual patient data. Start by reviewing normal EEG patterns across different age groups and alertness states until you can instantly identify the dominant frequency band in any recording segment. Build a mental library of normal variations so abnormalities stand out immediately during clinical sessions.
One practical study technique involves creating a reference chart listing each band with its frequency range, typical amplitude, normal scalp distribution, and common clinical associations. Delta waves at zero point five to four hertz dominate during deep sleep and should not appear prominently in awake alert adults. Theta at four to eight hertz is normal during drowsiness and childhood but pathological when excessive in awake adults. Having this organized reference facilitates rapid review and helps technologists quickly categorize unfamiliar patterns encountered during live monitoring sessions.
Alpha band recognition deserves special attention because the posterior dominant rhythm is the single most important finding in routine EEG interpretation. A normal alpha rhythm at eight to thirteen hertz should be symmetric between hemispheres, reactive to eye opening, and predominant over posterior regions. Asymmetry greater than one hertz in frequency or fifty percent in amplitude between sides is potentially significant. Practice identifying variants such as the mu rhythm over central regions and the tau rhythm over temporal areas to expand your interpretive repertoire.
Beta activity at thirteen to thirty hertz carries important clinical implications despite its low amplitude. Diffuse excess beta often indicates benzodiazepine or barbiturate use and is among the most common medication-related EEG findings encountered in clinical practice. Focal beta enhancement over skull defects reflects reduced impedance, a phenomenon called breach rhythm. Asymmetric beta reduction may suggest structural lesions. Systematically evaluating beta distribution across all channels ensures this clinically relevant frequency band receives appropriate attention during every interpretation session you perform.
Gamma oscillations above thirty hertz represent the least commonly discussed clinical band partly because scalp electrodes have limited sensitivity to these high-frequency signals attenuated by skull and scalp tissue. However, gamma has become increasingly important in research where it is associated with sensory processing, memory consolidation, and conscious awareness. Intracranial recordings bypass skull attenuation and reveal rich gamma activity providing valuable localizing information during presurgical epilepsy evaluations. Advancing electrode technology may eventually bring gamma analysis into routine clinical practice.
Artifact recognition is an essential complementary skill to frequency band identification that separates competent from expert interpreters. Muscle artifact from jaw clenching produces high-frequency signals mimicking beta or gamma activity. Eye movements generate slow waves confused with frontal delta. Electrocardiographic artifact introduces rhythmic signals at heart rate that overlap delta or theta ranges. Developing the ability to distinguish these artifacts from genuine cerebral signals prevents misinterpretation and ensures frequency band analysis accurately reflects brain electrical activity rather than contaminating noise sources.
Stay current with evolving frequency band applications by reviewing published literature and attending professional development courses regularly. Quantitative EEG techniques including power spectral analysis and coherence mapping are expanding clinical utility beyond traditional visual interpretation methods. Machine learning algorithms trained on large EEG databases are beginning to automate frequency band classification with promising accuracy. Whether your goal is clinical certification or research expertise, deep understanding of EEG frequency bands provides the foundation for professional growth in this dynamic and rewarding neurodiagnostic field.
EEG Questions and Answers
EEG for Seizures: How the Test Diagnoses Epilepsy and What to Expect
EEG Tech Salary 2026: Pay by State, Experience, and Certification
EEG Images: A Visual Guide to Brain Wave Patterns, Recordings, and Test Results
What Does an EEG Measure? Brain Waves, Electrical Activity, and What Your Results Reveal
24 Hour EEG: What to Expect, How It Works, Costs, and Results Explained
About the Author
Educational Psychologist & Academic Test Preparation Expert
Columbia University Teachers CollegeDr. Lisa Patel holds a Doctorate in Education from Columbia University Teachers College and has spent 17 years researching standardized test design and academic assessment. She has developed preparation programs for SAT, ACT, GRE, LSAT, UCAT, and numerous professional licensing exams, helping students of all backgrounds achieve their target scores.