Percentage Increase Formula Excel: The Complete Guide 2026 June
🟢 Master the percentage increase formula in Excel with step-by-step examples, shortcuts, error fixes, and real-world use cases for finance and reporting.

The percentage increase formula in Excel is one of those small-but-mighty calculations that comes up everywhere. Finance teams use it for revenue growth. Marketers track it to measure campaign lift. Operations staff watch it to spot rising costs. Students learning Excel essentials hit it within their first few hours of study, and recruiters ask about it in technical interviews for roles that involve any reporting at all.
The good news? Once you understand the math behind a percentage change, Excel makes it almost effortless. The bad news? Most people learn the formula wrong the first time, then carry that mistake into spreadsheets that managers actually rely on. This guide fixes that. You will get the core formula, the variations that handle negative numbers, the dollar-sign tricks for locking references, and the exact keystrokes to format your result as a clean percentage instead of an ugly decimal.
The core percentage increase formula in Excel
The basic formula has not changed in decades, and it works the same way in Excel 2007, Excel 365, and Excel for the Web. Here it is in plain text: =(New Value - Old Value) / Old Value. That gives you a decimal. Multiply by 100 if you want a number like 25, or apply the percent format if you want Excel to show 25% for you.
Let's anchor it with a real example. Say your January revenue was $4,000 and your February revenue jumped to $5,000. Put 4000 in cell A2 and 5000 in B2. In C2, type =(B2-A2)/A2 and hit Enter. You get 0.25. Click the percent button on the Home ribbon (or press Ctrl+Shift+%) and that 0.25 turns into 25%. February was 25% higher than January. That's the entire trick.
The reason it works is that you're asking Excel: "How big is the change relative to where I started?" Subtraction gives you the raw change. Dividing by the original number scales that change against the baseline. If you skip the division step, you just get a dollar amount, not a percentage. And if you divide by the new value instead of the old one, you'll get a number that's mathematically meaningful but doesn't answer the question most people are actually asking.
Why people get the formula wrong
The most common mistake is dividing by the wrong cell. People remember "subtract and divide" but forget that you always divide by the starting number. Reverse those two cells and you'll compute the wrong baseline. A second common error is forgetting the parentheses. Without them, Excel follows standard order of operations and divides B2 by A2 first, then subtracts A2 from that result. The number you get back will be wildly wrong, and worse, it'll look plausible.
A third mistake hits new users especially hard: pressing Enter and seeing 0.25 in the cell. They assume the formula is broken. It isn't. Excel returns percentages as decimals by default. The number is right; the formatting just hasn't caught up. One click of the percent style button fixes it.
Percentage Formula Quick Stats
The One-Line Rule
Always divide by the old value, never the new one. Subtraction gives you the change; dividing by the baseline scales that change into a percentage you can compare across periods.
Percentage decrease uses the same formula
Here's something a lot of tutorials skip: you don't need a separate formula for percentage decrease. The same =(New - Old) / Old structure handles both directions. If the new value is smaller, Excel returns a negative number. Drop $5,000 to $4,000 and you get -0.20, or -20% once you apply percent formatting. The negative sign is your decrease indicator.
This matters because beginners often build two different formulas, one for growth and one for decline, and then write IF statements to pick between them. That's wasted effort. Use one formula. Let the sign tell you the direction. If you want the absolute value for a chart, wrap the result in ABS(). If you want it expressed as a positive number with a direction label, use an IF combined with ABS, but that's a presentation choice, not a math requirement.
Locking references with dollar signs
Things get interesting the moment you want to compare a column of new values against a single baseline. Suppose A1 holds your starting figure of $1,000 and column B holds monthly totals for the next twelve months. You want column C to show the percentage change against January for every month. Type =(B2-$A$1)/$A$1 in C2 and drag it down. The dollar signs lock A1 in place while B2 ticks down to B3, B4, B5, and so on.
Without those dollar signs, Excel would shift the A1 reference along with the B2 reference, and you'd end up dividing by random cells. The F4 keyboard shortcut adds the dollar signs for you when you're editing a formula. Tap it once for full lock, twice to lock only the row, three times to lock only the column. Mastering absolute references is one of the skills that separates spreadsheet beginners from working analysts, and you can practice it directly with our Microsoft Excel formulas practice test.
Formatting the result as a percentage
Excel gives you several ways to switch a decimal to percent display. The fastest is Ctrl+Shift+5 (sometimes shown as Ctrl+Shift+%). Click the cell, hit the shortcut, done. The ribbon button on the Home tab in the Number group does the same thing with one click. If you want more control over decimal places, right-click the cell, choose Format Cells, switch to the Number tab, pick Percentage, and set the decimal places to 0, 1, or 2 depending on how precise you need the report to look.
One catch worth knowing: applying percent format to a cell that already contains a whole number multiplies the display by 100. So 25 becomes 2500%. If you've already done the multiplication by hand, switch to General format instead, or simply remove the multiplication step from your formula. Pick one approach and stay consistent. Mixing methods inside a single workbook is how 250% growth reports end up on the CEO's desk.
Formula Anatomy
New value minus old value gives you the raw change in units or dollars.
Dividing by the old value rescales the change against the baseline you started from.
Apply percent style with Ctrl+Shift+5 so the decimal displays as a clean percentage.
Use dollar signs ($A$1) when you want one cell to stay fixed as you drag the formula down.
Formula by Scenario
Revenue moved from $4,000 to $5,000. Formula: =(B2-A2)/A2 returns 0.25 or 25%. Format the cell as percentage and the result reads correctly without manual multiplication. Drag the same formula down a column of monthly values to track month-over-month performance instantly.
Handling zero and negative starting values
Mathematics has a fit when the starting value is zero. Dividing anything by zero gives you a #DIV/0! error in Excel, and rightly so: a percentage increase from nothing to something is technically infinite. The cleanest workaround is an IFERROR wrapper: =IFERROR((B2-A2)/A2, "N/A"). That catches the divide-by-zero case and shows N/A or any text you prefer. For dashboards aimed at executives, "New" or "Launch" reads better than a raw error code.
Negative starting values cause a different headache. If you started at -$500 in profit and moved to -$200, the formula returns 0.60 (a 60% improvement), but the direction can confuse readers because the numbers themselves are still negative. The math is correct, but the presentation often needs a note explaining what "increase" means when both sides are losses. For accounting use, many teams switch to absolute changes (dollar variances) when negatives are involved, then add a percentage column only where the baseline is positive.
Real-world examples by use case
Sales growth month over month. Sales in January: $42,300. February: $48,900. Formula: =(48900-42300)/42300 = 0.156 = 15.6%. Drag this down a column of monthly values and you'll see month-on-month growth at a glance. Pair it with conditional formatting (green for positive, red for negative) and you've built a simple dashboard.
Year-over-year comparison. Q4 2023 revenue: $1.2M. Q4 2024 revenue: $1.55M. Formula: =(1550000-1200000)/1200000 = 0.2917 = 29.2%. Finance teams use this in board decks every quarter. The trick at scale is laying the data out in two columns (prior year, current year) and dropping the formula in a third.
Price markup. Cost to manufacture a product: $18. Retail price: $45. Markup: =(45-18)/18 = 1.5 = 150% markup over cost. Note this is markup, not margin; margin is calculated differently and gives a smaller number.
Discount calculation. Original price $80, sale price $52. Discount: =(52-80)/80 = -0.35 = -35%. The negative sign tells you it's a reduction. Many retail spreadsheets flip the sign with ABS for display purposes, then label the column as "Discount %" so readers know the context.

If the old value is zero, Excel returns a divide-by-zero error. Wrap your formula in IFERROR like this: =IFERROR((B2-A2)/A2, "N/A"). This keeps dashboards clean and prevents red error codes from showing up in executive reports. For finance dashboards, replace "N/A" with "New" or "Launch" so the context reads naturally.
Pre-Flight Checklist
- ✓Confirm the old value is in the denominator, not the new value
- ✓Wrap the subtraction in parentheses to enforce order of operations
- ✓Apply percent format (Ctrl+Shift+5) instead of multiplying by 100 manually
- ✓Use dollar signs ($A$1) to lock the baseline when dragging the formula
- ✓Wrap with IFERROR if any baseline cells might contain zero
- ✓Double-check the sign: negative results mean decrease, positive mean increase
- ✓Verify cells contain numbers, not text imports that look like numbers
Shortcuts that save real time
If you're computing percentages across hundreds of rows, learn these keystrokes cold. Ctrl+Shift+5 applies percent format. F4 cycles through absolute reference types while editing a formula. Ctrl+D copies the formula in the active cell down through a selected range. Ctrl+R does the same horizontally. Alt+H+P opens the percent style button without leaving the keyboard. Pair these with the formula and you'll work two to three times faster than someone clicking through menus.
One more pro tip: double-clicking the small green square at the bottom-right of a selected cell (the fill handle) auto-fills the formula down the column for as long as there's adjacent data. No dragging required. This is one of the highest-leverage shortcuts in Excel, and it works for any formula, not just percentage calculations.
Common errors and how to fix them
#DIV/0! means you divided by zero. Wrap your formula in IFERROR or use an IF statement to check the baseline first. #VALUE! means one of your cells contains text instead of a number; check that you haven't accidentally typed "1,000" with quotes or imported a column where numbers came in as strings. Excel's "Convert to Number" prompt from the small green triangle in the corner of a cell will fix string-number issues fast.
If your result looks suspiciously round (like exactly 100% or 50%), suspect a circular reference or a wrong cell. Recheck which cell is the old value and which is the new. And if your percentage is off by exactly a factor of 100, you've either double-applied the percent format or mixed multiplied and formatted approaches in the same column.
Display Method Comparison
- +Percent format keeps the underlying value as a decimal for chaining into other formulas
- +One keyboard shortcut applies it to entire columns instantly
- +Decimal precision can be controlled through Format Cells
- +Works consistently across Excel desktop, web, and mobile versions
- +Charts pick up the format automatically without extra configuration
- +Preserves audit trail because the stored value never changes
- −Manual multiplication by 100 changes the stored value, breaking downstream math
- −Mixing both approaches in one sheet leads to results that are off by 100x
- −New users often see 0.25 in a cell and assume their formula is broken
- −Format Cells dialog has more options but takes longer than the ribbon button
- −Copying displayed values as text loses the underlying precision
- −Cross-team sheets can break when collaborators apply different methods
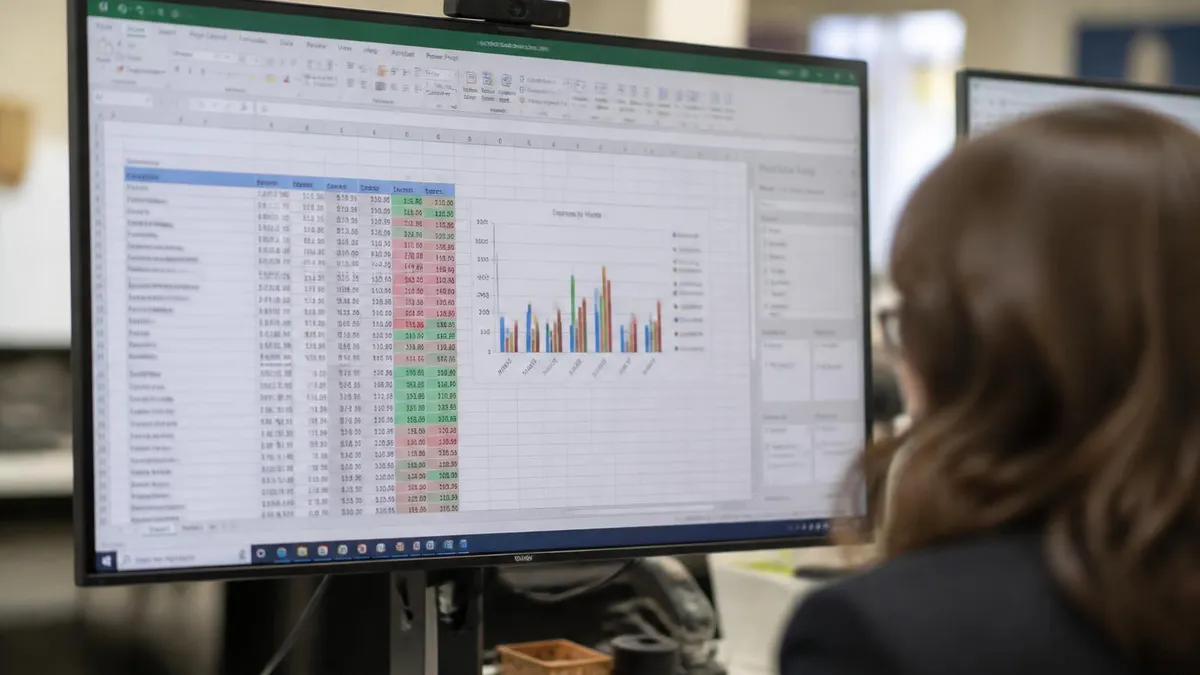
Building a percentage change dashboard from scratch
Once you understand the formula, the next step is using it inside a real reporting layout. Picture a four-column setup: column A for the period label (Jan, Feb, Mar), column B for prior-period values, column C for current-period values, and column D for the percentage change. Drop your formula =(C2-B2)/B2 in D2, format it as percent, and copy it down. That's a usable mini-dashboard in about three minutes.
Add a conditional formatting rule next. Select column D, go to Home > Conditional Formatting > Color Scales, and pick the green-yellow-red gradient. Now every positive percentage glows green and every negative one turns red. You can flip the scale if you're tracking costs (where increases should be red). For audiences who skim more than they read, color cues are far more effective than raw numbers buried in a table.
If you're tracking dozens of metrics at once, swap the gradient for an icon set. Up-arrow, sideways-arrow, down-arrow. The eye picks those up faster than colors, and they print cleanly in black-and-white. A good dashboard makes the answer obvious before anyone scrolls.

Dashboard Setup in Four Steps
Period label, prior value, current value, percentage change. Keeps the math visible and auditable for any reviewer.
Use =(C2-B2)/B2 in the change column, apply percent format, and double-click the fill handle to copy down.
Conditional Formatting > Color Scales gives an instant heat map. Flip the scale for cost metrics where increases are bad.
Up/sideways/down arrows scan faster than colors and print cleanly in monochrome handouts.
Percentage change versus percentage points
This trips up even experienced analysts. If a conversion rate moved from 4% to 6%, you can describe that two ways and only one is correct in any given context. The change is two percentage points (6 minus 4). The percentage change is 50% ((6-4)/4 = 0.50). Both are true, but they answer different questions. Mix them up in a board deck and a sharp executive will catch it instantly.
Rule of thumb: if you subtract two percentages directly, label the result as "percentage points" or "pp." If you compare them as a ratio using the percentage change formula, label it as a "percent increase" or "percent decrease." Excel handles either calculation; the discipline is in how you label the output.
Speed-running percentage change with cell ranges
For one-off comparisons of multiple periods, you can skip the helper columns entirely. Suppose A1:A12 holds monthly revenue for last year and B1:B12 holds this year's figures. The total annual change is =(SUM(B1:B12)-SUM(A1:A12))/SUM(A1:A12). One cell, one formula, total year-over-year movement. The same trick works for averages: =(AVERAGE(B1:B12)-AVERAGE(A1:A12))/AVERAGE(A1:A12) gives you the change in average monthly performance.
These compound formulas are how power users compress reporting work that would otherwise take five or six helper cells into a single readable line. They're also exactly the kind of pattern that shows up on Excel proficiency tests, so they're worth practicing until they feel natural to type from memory.
Moving from 4% to 6% is a 2 percentage point shift but a 50% percent increase. Both numbers are true and both come from different calculations. Label your column "pp" for direct subtraction and "%" or "% change" for the ratio formula. Audit teams check for this exact mix-up.
Rounding decisions matter more than you think
A 7.4% increase and a 7.5% increase look almost identical to a human reader, but the rounding rule you pick can shift a quarterly report by hundreds of basis points across many rows. Excel's percent format rounds for display only; the underlying value stays precise. That's usually what you want. Problems start when someone copies a displayed value (7.4%) into a new cell as text or as a hard-coded number, losing the original precision.
For audit-ready work, always reference the original calculated cells in any further math. Don't retype values. If you do need to round explicitly (say, for a printed table), use the ROUND function: =ROUND((B2-A2)/A2, 4) keeps four decimal places, which is enough for a percentage display down to the hundredth. ROUNDUP and ROUNDDOWN give you directional control if rounding-up your forecast is more conservative than rounding-down.
Where to go from here
Percentage change is a gateway formula. Once you have it down, the same logic powers compound annual growth rate (CAGR) calculations, variance analysis, and a dozen other finance staples. The pattern of "difference divided by baseline" appears everywhere from inventory turnover to user retention metrics. Spending an hour drilling this single formula pays off for years.
Ready to test what you've learned? Our free Excel skills assessment includes percentage and formula questions like the ones you'll see in real job interviews. You can also work through basic Excel functions if you want to round out your toolkit with SUM, AVERAGE, and IF before tackling more advanced reporting work.
Excel Questions and Answers
About the Author
Business Consultant & Professional Certification Advisor
Wharton School, University of PennsylvaniaKatherine Lee earned her MBA from the Wharton School at the University of Pennsylvania and holds CPA, PHR, and PMP certifications. With a background spanning corporate finance, human resources, and project management, she has coached professionals preparing for CPA, CMA, PHR/SPHR, PMP, and financial services licensing exams.