Excel Tutorial for Beginners: Complete Step-by-Step Guide to Master Spreadsheets
Master this excel tutorial for beginners with formulas, VLOOKUP, drop down lists, merging cells, freezing rows, and removing duplicates. Start today.

This excel tutorial for beginners is built to take you from a blank spreadsheet to confident workbook builder in a single sitting. Microsoft Excel is the world's most widely used data tool, powering everything from household budgets to Fortune 500 financial models. The skills you build here translate directly to higher pay, faster work, and the ability to answer questions that would take hours by hand. We will start with the ribbon, cells, and rows, then move into formulas, formatting, and lookup functions that hiring managers actually test for during job interviews.
Before we open Excel, it helps to understand what a spreadsheet really is. Think of it as an enormous grid of tiny calculators, each able to hold a number, a word, a date, or a formula that references its neighbors. When you change one cell, every formula that depends on it recalculates instantly. That cascade is what makes Excel feel almost magical when you finally see it working. You enter inputs in one place, and the entire model updates without you lifting a finger.
The current version of Excel ships with roughly 17 billion cells per worksheet, more than 480 built-in functions, and the new dynamic array engine that returns multiple results from a single formula. You do not need to learn all of them. Studies of working analysts show that fewer than 30 functions cover 95 percent of daily tasks. This guide focuses on that critical 30, plus the keyboard shortcuts and navigation tricks that separate beginners from people who look like they have been using Excel for a decade.
We will also cover the small habits that prevent disasters. Naming your worksheets, freezing the header row, locking reference cells with dollar signs, and saving versions before big changes are the difference between a model your boss trusts and one that crashes during the Monday morning meeting. None of this is hard. It just requires someone to show you the right order, which most online tutorials never do because they jump straight into pivot tables before you understand what a relative reference even is.
By the end of this guide you will be able to build a complete sales tracker from scratch, write a VLOOKUP that pulls prices from a product list, create drop down menus that prevent typos in shared workbooks, and format reports that actually look professional when you email them to your team. You will also know how to remove duplicates from a messy contact list, freeze rows so headers stay visible while scrolling, and merge cells for clean titles without breaking your underlying data structure.
One quick note before we begin. Excel runs slightly differently on Windows, Mac, and the free web version. Most shortcuts in this tutorial use the Windows convention, with Mac equivalents called out where they matter. If you are on a Chromebook or do not have Microsoft 365, the browser version at office.com handles every example in this guide for free. You only need a Microsoft account to sign in, and you can build the same models we walk through below without paying a cent.
Excel for Beginners by the Numbers
Getting Started With the Excel Interface
Open Excel and Start a Blank Workbook
Learn the Ribbon and Quick Access Toolbar
Navigate Cells With Keyboard Shortcuts
Enter Your First Data and Formula
Save, Name Sheets, and Backup
Now that you can navigate Excel, let us dig into cells, rows, columns, and the formulas that make the program useful. Every cell has an address made of a column letter and a row number, so the top left cell is A1, the cell two to the right and one down is C2, and so on. The active cell address appears in the Name Box on the far left of the formula bar. You can type any address into that box and press Enter to jump there instantly, even across millions of rows.
Formulas always begin with an equals sign. Basic arithmetic uses plus, minus, asterisk, and forward slash for add, subtract, multiply, and divide. So =5*8 returns 40 and =A1/A2 divides the first cell by the second. The order of operations follows standard math rules, with parentheses overriding the default. Excel is also smart about ranges. Write =SUM(A1:A10) and it adds all ten cells. Write =AVERAGE(B2:B100) and you get the mean. Counting uses COUNT for numbers and COUNTA for any non-empty cell.
The dollar sign is the single most important symbol in Excel after the equals sign. When you write =A1, that reference moves if you copy the formula down. Write =$A$1 and it stays locked no matter where you paste it. Use =$A1 to lock only the column or =A$1 to lock only the row. This concept, called absolute versus relative referencing, is what beginners miss most often. Press F4 while editing a cell address to cycle through the four lock states automatically.
IF statements let your spreadsheet make decisions. The syntax is =IF(test, value if true, value if false). For example, =IF(B2>1000,"Big Order","Small Order") prints one of two labels based on the value in B2. You can nest IF statements, but once you go past two levels it becomes hard to read. Newer Excel versions include IFS, which handles multiple conditions cleanly. SUMIF and COUNTIF apply the same logic to totals and counts, which is how analysts build dashboards in minutes.
Text functions are equally powerful. LEFT, RIGHT, and MID pull characters out of a string. LEN counts characters, and TRIM removes extra spaces that ruin lookups. CONCATENATE or the ampersand operator joins text together, so =A1&" "&B1 combines first and last names with a space between them. The newer TEXTJOIN function takes a delimiter and ignores blanks, making it perfect for building comma separated lists from messy data. These functions clean data faster than any manual edit ever could.
Dates in Excel are stored as serial numbers, where January 1 of 1900 equals 1 and every day after adds one. That means you can subtract two dates to get the number of days between them, or add 30 to a date to find the deadline. The TODAY function returns the current date and updates every time the file opens. NOW adds the time. DATEDIF, an undocumented but reliable function, calculates years, months, or days between any two dates and is perfect for age or tenure calculations.
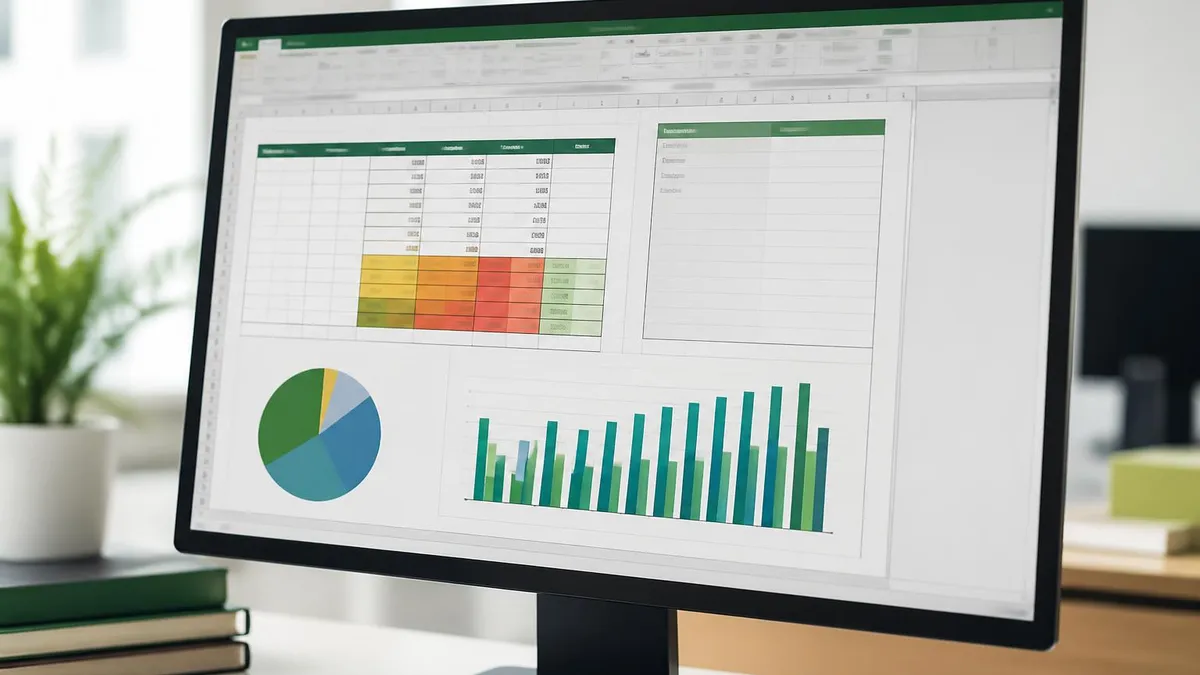
Charts turn numbers into pictures. Select your data, press Alt+F1, and Excel inserts a default chart instantly. Use the Chart Design tab to switch between bar, line, pie, and scatter formats. Stick to bar and line for most business reports because they communicate faster than pie or 3D variants. Add a chart title, label your axes clearly, and remove gridlines that distract from the data. A clean chart with two colors usually beats a busy one with seven.
VLOOKUP Excel, Drop Down Lists, and Data Tools
VLOOKUP is the function every employer asks about in Excel interviews. The syntax is =VLOOKUP(lookup value, table range, column number, FALSE). It searches the first column of your table for a match, then returns a value from any column to the right. Always use FALSE as the fourth argument unless your data is sorted, because TRUE returns approximate matches that silently corrupt reports.
A common example is pricing. Put product codes in column A and prices in column B. In another sheet, type =VLOOKUP("SKU123",Products!A:B,2,FALSE) and Excel returns the matching price. If VLOOKUP returns N/A, the value does not exist or has extra spaces. Wrap it in IFERROR to display a friendlier message: =IFERROR(VLOOKUP(...),"Not Found"). XLOOKUP, available in Microsoft 365, replaces VLOOKUP and looks left or right.

Should Beginners Start With Excel or Google Sheets?
- +Excel has more advanced functions and faster performance with large datasets above 100,000 rows
- +Microsoft 365 includes Power Query and Power Pivot for serious data analysis at no extra cost
- +Most US employers list Excel by name in job postings, not generic spreadsheet skills
- +Offline access means you can work on flights or in areas without reliable internet
- +Macros and VBA allow full automation that Google Sheets cannot match in complexity
- +Industry-standard certifications from Microsoft carry real weight on resumes and LinkedIn profiles
- −Excel requires a paid Microsoft 365 subscription for the full desktop experience
- −Real-time collaboration historically lagged behind Google Sheets, though it has improved
- −The interface feels overwhelming with hundreds of features hidden across ribbon tabs
- −Files can become corrupted or too large to email, requiring SharePoint or OneDrive
- −Mac and Windows versions have small but annoying differences in shortcuts and features
- −Learning curve is steeper than Google Sheets for absolute first-time spreadsheet users
Beginner Checklist for Your First Excel Workbook
- ✓Save your file with a clear name and date before entering any data
- ✓Add a title row in bold and freeze the top row so headers stay visible while scrolling
- ✓Use consistent date formats across every column, choosing either MM/DD/YYYY or YYYY-MM-DD
- ✓Avoid merging cells inside data tables because merges break sorting, filtering, and lookup formulas
- ✓Apply table formatting with Ctrl+T to enable automatic filters and structured references
- ✓Lock reference cells with dollar signs before copying formulas down or across
- ✓Build a separate inputs sheet so users change values in one place instead of hunting through formulas
- ✓Use Data Validation to create drop down lists for any field with limited valid options
- ✓Run Remove Duplicates on imported lists before joining them with VLOOKUP or XLOOKUP
- ✓Wrap every lookup formula in IFERROR to handle missing matches without ugly error text
- ✓Print preview your workbook before sending and set the print area to avoid blank pages
- ✓Save a clean backup copy whenever you finish a major section or hand the file to a colleague
Press F4 to lock cell references instantly
While editing a formula, place your cursor inside any cell reference and press F4. Excel cycles through absolute, mixed row, mixed column, and relative locks with each press. Mastering this single key cuts formula building time in half and prevents the number one beginner mistake of copying formulas that silently break.
Formatting transforms a raw data dump into a report someone actually wants to read. Start with the basics. Bold your header row, increase its font size by one or two points, and apply a light fill color so the header visually separates from data below. Right align numbers, left align text, and center dates. These three rules alone make a spreadsheet look professional. Avoid using more than two fonts or three colors in any single sheet, because visual noise distracts from the numbers.
Number formatting matters as much as data accuracy. Highlight your dollar amounts and press Ctrl+Shift+4 to apply currency format. Use Ctrl+Shift+5 for percentages and Ctrl+Shift+1 for comma separated thousands. Custom formats let you go further. The code #,##0;[Red](#,##0) displays positive numbers normally and wraps negatives in red parentheses, which is the convention every finance team uses. Right click a cell, choose Format Cells, then Custom to enter your own format codes.
Conditional formatting brings data to life. Select a range of numbers, click Home, then Conditional Formatting, and choose Color Scales or Data Bars. Suddenly your numbers tell a story at a glance. Use Highlight Cells Rules to color any value above a threshold red, or apply Top 10 to flag your best performers. Conditional formatting also handles duplicates beautifully, instantly shading repeats across a column so you can spot them before running Remove Duplicates.
How to freeze a row in excel is one of the most searched beginner questions, and the answer takes ten seconds. Click the View tab, then Freeze Panes, then Freeze Top Row. Now scroll down and your header stays visible. To freeze the top row and the first column together, click cell B2 first, then choose Freeze Panes. The freeze line appears as a thin dark border. To unfreeze, return to View, Freeze Panes, and click Unfreeze Panes.
How to merge cells in excel comes up constantly when building titles or section headers. Select the cells you want to merge, then on the Home tab click the Merge and Center button. Excel combines them into a single wider cell. Use Merge Across to merge each row separately or Unmerge Cells to reverse the action. Important warning: never merge cells inside data tables. Merges break sorting, filtering, and lookup formulas. For data, use Center Across Selection instead, which gives the visual effect without the structural problems.
Page setup is the last polish step before printing or exporting to PDF. On the Page Layout tab, set your margins to Narrow, orientation to Landscape for wide tables, and use Scale to Fit to squeeze everything onto one page. Set the print area by selecting your range and clicking Print Area, then Set Print Area. Add a header with the file name and a footer with the page number through the Page Setup dialog. These small touches make your workbook look like it came from a senior analyst.
Keyboard shortcuts cement everything. Ctrl+B bolds, Ctrl+I italicizes, and Ctrl+U underlines. Ctrl+1 opens the Format Cells dialog where every formatting option lives. Alt+H+H opens the fill color menu, while Alt+H+F+C opens font color. Alt+Enter inserts a line break inside a cell. Ctrl+; types today's date, and Ctrl+Shift+; types the current time. Spend an hour drilling these shortcuts and your formatting speed will rival people who have used Excel for years.

Merging cells looks tidy but quietly destroys spreadsheet functionality. Merged cells break sorting, prevent filtering, return wrong results in VLOOKUP, and crash pivot tables. Reserve merging for title rows above your data. For visual centering inside a table, use Format Cells, Alignment, then Center Across Selection instead. Your future self will thank you.
Once you have the fundamentals down, the fastest way to improve is to build real projects rather than watching more tutorials. Start with a personal budget. Create columns for date, category, description, and amount. Add a drop down list for category so every entry stays consistent. Use SUMIF to total spending by category, then build a small chart showing where your money goes each month. This single project teaches data entry, formulas, validation, and visualization in one focused exercise.
Your second project should be a sales tracker for an imaginary or real small business. List products on one sheet with prices, then on a second sheet record each transaction with a date, product code, and quantity. Use VLOOKUP to pull the price automatically and multiply by quantity to get the line total. Add a pivot table at the end of the month to see top products, best days of the week, and total revenue. Pivot tables are the single biggest force multiplier Excel offers.
The third project tests data cleaning skills. Download a free dataset from Kaggle or data.gov, then clean it. Remove duplicates, trim extra spaces with the TRIM function, standardize date formats, and split full names into first and last with Text to Columns. Practicing on real messy data is the only way to develop the instincts that hiring managers test for. Save your before and after files so you can show the work in interviews or on a portfolio site.
Pivot tables deserve their own focused study session. Select any data range, press Alt+N+V, and Excel offers to insert a pivot table. Drag fields into Rows, Columns, Values, and Filters to slice the data instantly. Change Sum to Average, Count, or Percentage with two clicks. Pivot tables answer questions that would take hours of formula writing in minutes, and they update with a right click refresh when source data changes. They are the single biggest leap from beginner to intermediate Excel user.
Power Query, hidden under the Data tab as Get and Transform, is the next layer of skill. It imports data from files, websites, and databases, then cleans and reshapes it through a recorded series of steps. The steps run automatically every time you refresh, so a report that took eight hours of manual work the first month takes thirty seconds the second month. Many analysts say learning Power Query was the most valuable Excel investment they ever made.
VBA macros automate anything you can do manually. Record a macro by clicking View, then Macros, then Record Macro. Perform your steps, stop recording, and Excel saves the code. Replay the macro with one click or assign it to a button. For deeper automation, press Alt+F11 to open the VBA editor and edit the code directly. Even basic macro skills make you stand out at work, because most colleagues consider VBA mysterious and refuse to learn it.
Certifications validate your skills publicly. The Microsoft Office Specialist Excel Associate exam costs around one hundred dollars and proves baseline competence. The MOS Excel Expert exam covers advanced features and is highly valued in finance, accounting, and operations roles. LinkedIn skill assessments are free, take fifteen minutes, and display a verified badge on your profile. Pair any of these credentials with a portfolio of three real projects and your resume jumps to the top of the pile.
The final lap of your beginner journey is building daily habits that compound over months. Open Excel for at least fifteen minutes every weekday, even if only to recreate something you already know. Repetition is what moves shortcuts from conscious effort to automatic muscle memory. Most people who claim Excel is hard simply have not put in the focused practice hours. Treat it like learning a language and you will sound fluent inside three months.
Keep a personal cheat sheet. Open a new workbook called Cheats and add a tab for every category, including Shortcuts, Formulas, Formatting, and Pivot Tables. Whenever you Google a technique, paste the solution into the right tab with a quick example. After six weeks you will have a custom reference that solves your specific work problems faster than any online tutorial. Searchable, personal notes beat generic resources every single time.
Join a community to accelerate learning. The r/excel subreddit answers questions within minutes and exposes you to creative solutions you would never find alone. The MrExcel forum has decades of archived threads on every imaginable problem. Excel Champs and ExcelJet publish daily tips on YouTube and email newsletters. Following two or three sources keeps fresh tricks flowing without overwhelming your inbox or learning queue.
Always ask why a formula works, not just how. When you learn VLOOKUP, understand that it scans the first column top to bottom. When you learn SUMIF, recognize it pairs a criteria range with a sum range. Conceptual understanding lets you adapt formulas to brand new problems instead of memorizing recipes that fail when conditions change slightly. This single shift separates Excel mechanics from Excel thinkers, and only the thinkers get promoted.
Audit your own work before sharing it. Press Ctrl+grave accent to toggle Show Formulas mode, then scan each column for inconsistencies. Run Formulas, then Error Checking, to find broken references. Use Trace Precedents and Trace Dependents under the Formulas tab to visualize how cells connect. Five minutes of audit catches mistakes that would otherwise reach your boss and damage your reputation. Senior analysts audit constantly because they have learned the cost of skipping it.
Back up everything. OneDrive and SharePoint version every save automatically, letting you restore previous versions with two clicks. If you work locally, copy your file to a date stamped folder at the end of each week. Excel files corrupt without warning, especially when they grow past fifty megabytes or contain heavy formula chains. A two minute backup habit has saved more careers than any single function in this entire guide.
Finally, stay curious about new features. Microsoft ships updates to Microsoft 365 every month. Dynamic arrays, XLOOKUP, LET, LAMBDA, and the new Python integration have all arrived in the past few years and each one solves problems that previously required complex workarounds. Read the Microsoft Excel blog or follow the Excel team on social media. Being the first person on your team to demo a new feature builds reputation faster than almost any other career move.
Excel Questions and Answers
About the Author
Attorney & Bar Exam Preparation Specialist
Yale Law SchoolJames R. Hargrove is a practicing attorney and legal educator with a Juris Doctor from Yale Law School and an LLM in Constitutional Law. With over a decade of experience coaching bar exam candidates across multiple jurisdictions, he specializes in MBE strategy, state-specific essay preparation, and multistate performance test techniques.