
Excel Status Bar: The Complete Guide to Using Every Feature at the Bottom of Your Screen
Master the Excel status bar: enable sum, average, count, zoom, and custom stats. Complete 2026 September guide for US Excel users. 🗨️

The excel status bar sits quietly at the very bottom of your Excel window, yet it is one of the most information-dense real estate strips in the entire application. Most users glance at it for the zoom slider and nothing else, but that thin ribbon can simultaneously display the sum, average, count, minimum, maximum, and numerical count of any selection you highlight — no formula required.
Whether you are a student preparing for a certification or a finance professional who spends ten hours a day in spreadsheets, learning to read and configure the status bar can shave meaningful time off repetitive lookup tasks.
The Excel status bar has existed in some form since Excel 97, but Microsoft substantially expanded its right-click customization menu starting with Excel 2007. Today, in Microsoft 365 and Excel 2021, you can toggle more than twenty different indicators on or off — from Page Number and Sheet View shortcuts to the less-known Upload Status and Accessibility Checker flags. Understanding which toggles matter for your workflow is the first step toward a truly personalized Excel environment.
Many learners who explore concepts like how to create a drop down list in excel, how to merge cells in excel, or how to freeze a row in excel eventually discover that the status bar ties all these skills together in a live feedback loop. When you select a column of merged cells, for instance, the status bar instantly tells you how many discrete values exist — a detail that becomes critical when you run a VLOOKUP excel formula and need to know whether your lookup column has duplicates hidden inside merged ranges.
The status bar also hosts the View shortcut buttons — Normal, Page Layout, and Page Break Preview — that let you switch worksheet viewing modes without navigating the Ribbon. For presenters who frequently toggle between editing and print-preview modes, this is a genuine time saver. Alongside those three icons sits the Zoom slider, a drag-to-scale control that most users treat as the bar's main attraction. But the calculation statistics on the left side of the bar are arguably more powerful because they eliminate entire categories of ad-hoc formula writing.
Beyond individual statistics, the status bar communicates workbook-level information. When you open a shared workbook or a file synced through OneDrive, a cloud upload indicator appears on the far right. In enterprise environments, you may also see Macro Recording indicators and Caps Lock or Num Lock status, all surfaced without opening a single dialog. These ambient signals align with the philosophy of excellence resorts — that a world-class environment surfaces exactly what you need, exactly when you need it, without clutter or confusion.
This guide covers every meaningful feature of the Excel status bar: how to enable and disable specific statistics, how to read each indicator correctly, how the bar behaves differently across sheet types, and how to use it strategically during data audits and formula troubleshooting. By the end, you will treat the status bar not as a passive display but as an active co-pilot that confirms your data assumptions in real time and flags anomalies before they turn into errors downstream in your analysis.
Excel Status Bar by the Numbers
What the Excel Status Bar Actually Shows You
When you select any range containing numbers, the status bar instantly displays Average, Count, Numerical Count, Minimum, Maximum, and Sum — without entering a single formula. Right-click the bar to toggle each statistic on or off based on your workflow.
Three buttons — Normal, Page Layout, and Page Break Preview — let you switch how the worksheet is rendered. Page Layout mode shows headers, footers, and print margins live, which is essential before exporting reports to PDF or printing.
The slider on the far right controls zoom from 10% to 400%. Clicking the percentage number opens the Zoom dialog for precise input. Hold Ctrl and scroll your mouse wheel for an even faster keyboard-friendly zoom adjustment.
A red circle icon appears in the status bar when you are recording a macro. Clicking it stops the recording immediately, eliminating the need to navigate to Developer → Stop Recording in the Ribbon — saving clicks in every recorded workflow.
In Microsoft 365, a cloud icon signals OneDrive sync status. A green checkmark means the file is fully saved online; a spinning arrow means a save is in progress. This prevents data loss by warning you before closing a partially synced workbook.
Customizing the Excel status bar is a process that takes about thirty seconds once you know where to look, yet the impact on your daily efficiency is surprisingly large. To open the customization menu, right-click anywhere on the status bar and a context menu of more than twenty checkable options will appear. Every option with a checkmark is currently visible; unchecked items are hidden. You can freely enable or disable any combination without affecting formulas, data, or any other part of the workbook — the status bar is entirely cosmetic from Excel's computational perspective.
The most commonly enabled statistics are Average, Count, and Sum because they answer the three most frequent data questions in any spreadsheet: what is the central tendency, how many rows am I looking at, and what is the total? Power users often add Minimum and Maximum as well, particularly when auditing salary tables, budget line items, or test scores where outliers matter.
The Numerical Count indicator is less understood — it counts only cells containing numbers, excluding text entries, which makes it invaluable for spotting rows where a number was accidentally entered as text and would therefore break a VLOOKUP excel formula lookup.
The Page Number indicator is another underappreciated toggle. When enabled, it shows the current page number and total page count whenever you are in Page Layout view. For financial analysts who produce multi-page reports — cashflow statements, audit trails, loan amortization schedules — this small indicator removes the need to scroll to the bottom of a long sheet to check whether the data spills onto an unexpected extra page. It pairs naturally with the Page Layout view shortcut button right beside the zoom slider.
Zoom controls deserve a dedicated section in any status bar tutorial because they are the feature new users interact with most. The slider responds to mouse drag, but a lesser-known trick is Ctrl+Scroll Wheel, which zooms in or out using the scroll wheel without touching the status bar at all.
For laptop users on a trackpad, pinch-to-zoom works in many versions of Microsoft 365 on Windows. For exact zoom levels — say, 75% to fit a wide table on screen without horizontal scrolling — clicking the numeric percentage display opens a precise Zoom dialog where you can type any value between 10 and 400.
Sheet view indicators are a relatively new addition to the status bar, introduced with collaborative Excel features. When multiple people are editing the same workbook simultaneously in Microsoft 365, a sheet view icon appears, letting each editor maintain a temporary view state (frozen rows, sort order, filter state) without disturbing collaborators. Understanding this indicator matters in team environments where one analyst filtering a column should not disrupt a colleague's screen — a level of collaboration etiquette that the institute of creative excellence in workplace productivity would certainly endorse as a best practice.
The Accessibility Checker indicator appears as a small person icon when Excel detects potential accessibility issues — missing alt text on charts, low-contrast colors, or unlabeled data ranges. For organizations that produce reports consumed by screen readers or that must comply with Section 508 or WCAG guidelines, this status bar icon acts as a live audit flag. Clicking it opens the full Accessibility Checker pane, which lists every issue and provides guided fixes. Building the habit of glancing at this icon before sending a workbook is far more efficient than running a manual audit at the end of a project.
Finally, the Caps Lock, Num Lock, and Scroll Lock indicators can be added to the status bar for users who find themselves accidentally activating these keys and puzzling over unexpected behavior. Scroll Lock in particular causes confusing behavior in Excel: instead of moving the active cell, the arrow keys scroll the entire sheet, leaving the selection unchanged. Many users spend minutes troubleshooting this behavior before realizing Scroll Lock is on. With the Scroll Lock indicator enabled on the status bar, the issue is immediately visible — a one-second fix for what otherwise becomes a multi-minute mystery in any productivity-focused session.
Microsoft Excel Practice Test Questions
Prepare for the Microsoft Excel exam with our free practice test modules. Each quiz covers key topics to help you pass on your first try.
Microsoft Excel Excel Basic and Advance
Microsoft Excel Exam Questions covering Excel Basic and Advance. Master Microsoft Excel Test concepts for certification prep.
Microsoft Excel Excel Formulas
Free Microsoft Excel Practice Test featuring Excel Formulas. Improve your Microsoft Excel Exam score with mock test prep.
Microsoft Excel Excel Functions
Microsoft Excel Mock Exam on Excel Functions. Microsoft Excel Study Guide questions to pass on your first try.
Microsoft Excel Excel MCQ
Microsoft Excel Test Prep for Excel MCQ. Practice Microsoft Excel Quiz questions and boost your score.
Microsoft Excel Excel
Microsoft Excel Questions and Answers on Excel. Free Microsoft Excel practice for exam readiness.
Microsoft Excel Excel Trivia
Microsoft Excel Mock Test covering Excel Trivia. Online Microsoft Excel Test practice with instant feedback.
Microsoft Excel Advanced Data Analysis Tools
Free Microsoft Excel Quiz on Advanced Data Analysis Tools. Microsoft Excel Exam prep questions with detailed explanations.
Microsoft Excel Advanced Formula and Macro...
Microsoft Excel Practice Questions for Advanced Formula and Macro Creation. Build confidence for your Microsoft Excel certification exam.
Microsoft Excel Advanced Formulas and Macros
Microsoft Excel Test Online for Advanced Formulas and Macros. Free practice with instant results and feedback.
Microsoft Excel Basic and Advance Question...
Microsoft Excel Study Material on Basic and Advance Questions and Answers. Prepare effectively with real exam-style questions.
Microsoft Excel Creating and Managing Charts
Free Microsoft Excel Test covering Creating and Managing Charts. Practice and track your Microsoft Excel exam readiness.
Microsoft Excel Data Visualization with Ch...
Microsoft Excel Exam Questions covering Data Visualization with Charts. Master Microsoft Excel Test concepts for certification prep.
Microsoft Excel Formulas and Functions
Free Microsoft Excel Practice Test featuring Formulas and Functions. Improve your Microsoft Excel Exam score with mock test prep.
Microsoft Excel Formulas and Functions App...
Microsoft Excel Mock Exam on Formulas and Functions Application. Microsoft Excel Study Guide questions to pass on your first try.
Microsoft Excel Formulas Questions and Ans...
Microsoft Excel Test Prep for Formulas Questions and Answers. Practice Microsoft Excel Quiz questions and boost your score.
Microsoft Excel Functions Questions and An...
Microsoft Excel Questions and Answers on Functions Questions and Answers. Free Microsoft Excel practice for exam readiness.
Microsoft Excel Managing Data Cells and Ra...
Microsoft Excel Mock Test covering Managing Data Cells and Ranges. Online Microsoft Excel Test practice with instant feedback.
Microsoft Excel Managing Tables and Data
Free Microsoft Excel Quiz on Managing Tables and Data. Microsoft Excel Exam prep questions with detailed explanations.
Microsoft Excel Managing Tables and Table ...
Microsoft Excel Practice Questions for Managing Tables and Table Data. Build confidence for your Microsoft Excel certification exam.
Microsoft Excel Managing Worksheets and Wo...
Microsoft Excel Test Online for Managing Worksheets and Workbooks. Free practice with instant results and feedback.
Microsoft Excel MCQ Questions and Answers
Microsoft Excel Study Material on MCQ Questions and Answers. Prepare effectively with real exam-style questions.
Microsoft Excel Questions and Answers
Free Microsoft Excel Test covering Questions and Answers. Practice and track your Microsoft Excel exam readiness.
How to Create a Drop Down List in Excel Using Status Bar Feedback
When you select a contiguous column of numeric data — say, a column of monthly sales figures — the status bar immediately shows the sum and average of all selected cells in the lower-right area of the Excel window. This instant feedback is especially useful when you are validating data entered through a drop-down list: after users pick values from a validated list, select the entire input column and confirm the aggregate matches your expected total without writing a single SUM formula. The sum display updates in real time as you extend or shrink your selection, making it ideal for quick sanity checks before presenting numbers in a meeting.
Average works the same way but is particularly powerful for performance data — student scores, employee ratings, or customer satisfaction numbers. Excel calculates the arithmetic mean of all numeric values in the selection, ignoring blank cells automatically. This differs slightly from the AVERAGE formula, which also ignores blanks but may behave differently if your range contains error values like #N/A. If the status bar average and your formula average disagree, suspect error values or text-formatted numbers hiding in the selected range, which the Numerical Count indicator will help you diagnose immediately.
Excel Status Bar: Strengths and Limitations
- +Displays sum, average, count, min, and max instantly without writing any formula
- +Right-click customization lets you enable or disable any indicator in under 10 seconds
- +Zoom slider and view mode buttons reduce Ribbon navigation for everyday tasks
- +Numerical Count vs. Count discrepancy instantly reveals text-formatted numbers
- +Macro recording indicator provides a one-click stop button during macro creation
- +Cloud sync and upload status icons prevent data loss in OneDrive-connected workbooks
- −Statistics are not persistent — deselecting the range clears all displayed values
- −Cannot copy status bar values directly into a cell without re-writing a formula
- −Does not display statistics for non-contiguous multi-sheet selections reliably
- −Zoom slider position resets to 100% when a new sheet is activated by default
- −Accessibility Checker icon only appears for certain issue types, not all WCAG violations
- −Scroll Lock indicator is hidden by default, leaving many users confused when it activates
Excel Status Bar Power-User Checklist
- ✓Right-click the status bar and enable Sum, Average, Count, Numerical Count, Min, and Max simultaneously.
- ✓Enable the Scroll Lock indicator so unexpected arrow-key behavior is diagnosed in seconds.
- ✓Add the Page Number indicator if you regularly produce multi-page printed or PDF reports.
- ✓Check Count vs. Numerical Count after every data import to catch text-formatted numbers early.
- ✓Use the Zoom slider to set column-fitting zoom levels before sharing screenshots or screen recordings.
- ✓Click the upload status icon before closing any cloud-connected workbook to confirm sync completion.
- ✓Enable the Macro Recording indicator so you can stop recordings with a single click from the status bar.
- ✓Switch to Page Layout view via the status bar shortcut when adjusting print margins or adding headers.
- ✓After selecting a filtered range, verify the status bar Count matches your expected filtered row total.
- ✓Screenshot the status bar statistics before deselecting any range you need to document for an audit trail.
Count vs. Numerical Count: Your Fastest Data Quality Check
If the Count and Numerical Count shown in your status bar do not match after selecting a column, you have text-formatted numbers hiding in your data. These silent errors break SUM, AVERAGE, and VLOOKUP formulas without any visible warning. Select the discrepant cells and use Data → Text to Columns or the VALUE() function to convert them before building any calculations on top of that column.
The behavior of the Excel status bar changes in meaningful ways depending on which type of sheet is currently active. On a standard worksheet, you get the full suite of calculation statistics, view mode buttons, and zoom controls. But on a chart sheet — a sheet that contains only an embedded chart with no grid cells — the calculation statistics area disappears entirely because there is no cell selection to aggregate.
The view controls remain, but zooming behaves differently: Excel zooms the chart object rather than a cell grid, so the interaction feels less precise. If you find yourself on a chart sheet and wonder why the status bar looks bare, this is the explanation.
Protected sheets introduce another behavioral nuance. When a worksheet is protected and you have selected a locked range, the status bar still displays aggregate statistics for the selection — the protection does not suppress read-only visibility. However, the Macro Recording indicator may be grayed out or hidden on protected sheets, depending on how the protection was configured. Analysts who work in heavily protected compliance models should verify whether their team's status bar customization survived the protection step, because the right-click menu itself may be disabled on certain protected workbooks to prevent users from changing the display.
Excel Tables — structured tables created with Ctrl+T or Insert → Table — interact with the status bar in a particularly elegant way. When you click inside a Table column and extend your selection, the status bar reflects only the data rows, automatically excluding the header and any Total Row if you have enabled that Table feature.
This prevents the accidental inclusion of a text header in your Count, which would inflate the count by one in a plain range selection. For analysts who obsess over data integrity — the kind of discipline championed by the inner excellence book philosophy of relentless attention to detail — this automatic exclusion is a small but meaningful guard against error.
Pivot tables present yet another variation. When you select cells inside a PivotTable report, the status bar statistics reflect the values in those cells just as they would in any range. However, if you select a cell in the Row Labels or Column Labels area of the pivot, you may see a Count that includes hidden items not visible in the current filter view.
This can produce a misleading aggregate. The safest practice is to read pivot data statistics from the PivotTable's own built-in summary row rather than relying on the status bar when the pivot has active slicers or report filters applied.
For users who work with multiple monitors, the status bar can become hard to read when Excel is not maximized or when two workbooks are tiled side by side. In these layouts, the status bar may truncate some of the enabled statistics if the window is too narrow to display all of them.
Excel uses a priority order — it will always show Sum if enabled, then Average, then Count — and simply omits lower-priority statistics when space runs out. If you are on a wide monitor but tiling windows at 50% width, this truncation can hide useful statistics. The fix is simply to widen the window or reduce the number of enabled indicators to the three or four you use most often.
Excel on Mac shares the same status bar architecture as Windows, but there are minor UI differences. The Zoom slider on Mac does not have a clickable percentage display in all versions — you may need to use the View menu for precise zoom. The right-click customization menu on Mac is slightly shorter, omitting some Windows-specific indicators like Upload Status unless the file is synced via OneDrive.
If you prepare for an Excel certification exam that covers interface features, be aware that exam questions typically target the Windows version unless explicitly labeled otherwise, so study the Windows status bar layout even if you practice primarily on Mac.
Finally, the status bar in Excel Online (the browser-based version of Excel available through Microsoft 365) is significantly more limited than the desktop application. As of 2025, Excel Online shows only Sum, Average, and Count in the status bar, with no right-click customization menu. The Zoom slider is present but does not include the precise percentage display. View mode shortcuts are replaced by a simpler View tab in the Ribbon.
For power users, this limitation is a strong argument for using the desktop application for any serious data work. If you are preparing for an exam or interview and your access to desktop Excel is limited, even a brief session in the desktop app — perhaps through a free trial of Microsoft 365 — is worth the effort to experience the full status bar feature set firsthand.
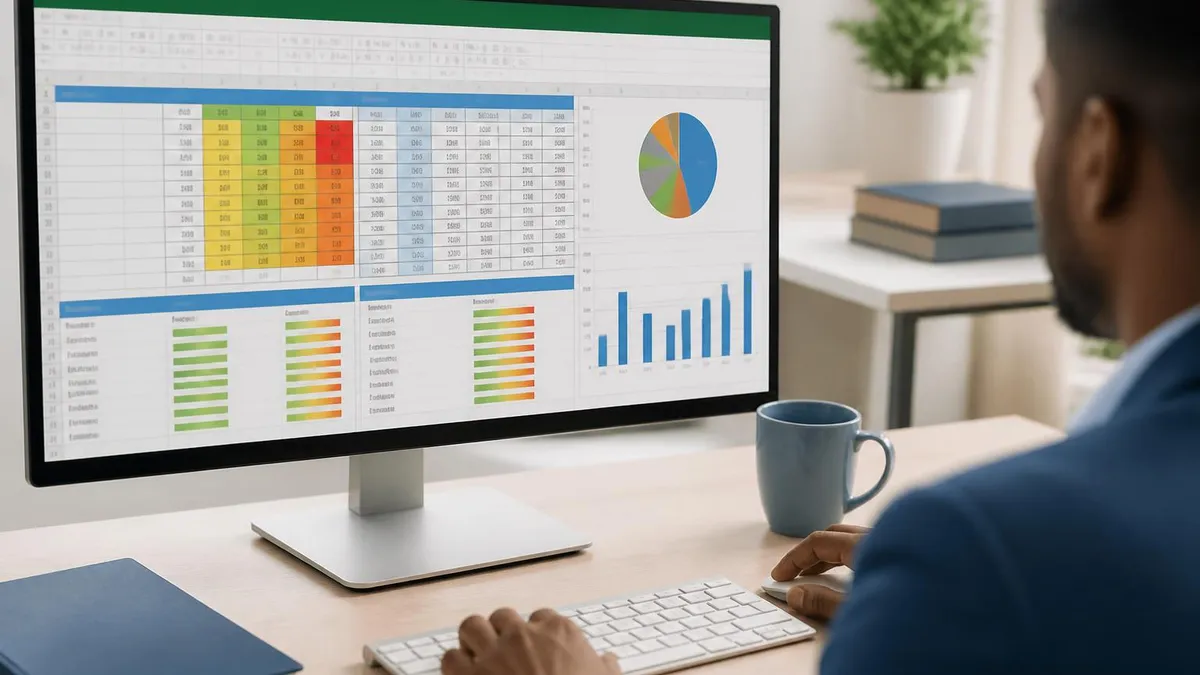
The aggregate values shown in the Excel status bar — sum, average, count, minimum, maximum — are display-only and are never stored anywhere in the workbook. If you deselect the range or click a different cell, those numbers vanish. For audit trails, compliance documentation, or any situation where you need to record an aggregate value, paste it into a cell using a formula or screenshot the status bar before deselecting your range.
Troubleshooting discrepancies between the status bar and your formula results is one of the most practical skills an intermediate Excel user can develop, and it almost always points to one of four root causes. The most common is text-formatted numbers, already discussed in the context of the Numerical Count indicator. The second most common is hidden rows.
When you select a range that includes hidden rows, the status bar statistics include the values in those hidden cells — unlike SUBTOTAL or AGGREGATE functions, which can be configured to ignore hidden rows. If your status bar sum does not match a SUBTOTAL(9,...) formula covering the same range, hidden rows are almost certainly the explanation.
Filtered data creates a related but distinct scenario. When a column filter is active and you select the visible cells, the status bar Count reflects only the visible rows. This is actually the correct behavior for most analysis contexts — you want to know how many rows pass the current filter. But Sum and Average in the status bar also reflect only visible cells, which means they match a SUBTOTAL formula rather than a plain SUM.
Knowing this equivalence helps you choose the right formula when you need to lock in that filtered aggregate permanently rather than relying on the transient status bar display. The AGGREGATE function offers even more flexibility, with options to ignore errors and hidden rows simultaneously.
Error values in a selected range cause the status bar to display no numeric statistics at all for Sum and Average — a single #DIV/0! or #N/A in the selection makes those fields go blank. Count still shows the total cell count including the error cells, but Numerical Count excludes them.
If your status bar Sum suddenly shows nothing despite selecting what appears to be a numeric range, scroll through the selection looking for error values, or use Ctrl+G → Special → Errors to jump directly to error cells. Fixing or wrapping those errors with IFERROR restores the status bar statistics instantly.
The fourth common troubleshooting scenario involves merged cells, particularly relevant given how many users learn how to merge cells in excel before understanding the downstream consequences. Merged cells in a selection register as a single cell in the Count, and only the top-left cell's value is counted in numeric aggregates.
If you have a table where values are split across merged rows for visual presentation purposes, the status bar statistics will dramatically undercount your data. The correct fix is to unmerge the cells and use cell formatting (center across selection, or matching border styles) to achieve the visual effect without the data integrity compromise that merging introduces.
Beyond troubleshooting, the status bar serves a proactive role in formula auditing sessions. A common technique is to select the inputs to a formula — say, the cells referenced by a complex nested IF — and check the status bar's Count to confirm you have selected exactly as many cells as you intended. Then check Numerical Count to verify all inputs are genuinely numeric.
This two-second check, repeated at each input range in a complex model, catches a surprising proportion of formula errors before they propagate. It is the kind of systematic habit that distinguishes analysts who ship reliable models from those who frequently revisit their own work to chase down mysterious discrepancies.
For users building dashboards or reports consumed by non-technical stakeholders, the status bar also provides a quick way to verify that data validation rules are working correctly. After restricting a column to accept only values from a drop-down list (how to create a drop down list in excel is one of Excel's most searched tasks), select the entire column and check Count versus Numerical Count.
If the counts diverge and you expected only numeric inputs, someone may have bypassed the validation by pasting data. The status bar surfaces this in under three seconds — no VBA, no audit formula, no manual scrolling required.
Rounding out the troubleshooting toolkit, the Page Break Preview mode accessible from the status bar view shortcuts is indispensable for fixing print layout issues. Switching to this view converts the worksheet to a blue-and-white grid where solid blue lines represent manual page breaks and dashed blue lines represent automatic page breaks.
You can drag these lines to reposition breaks, effectively controlling exactly which rows fall on each printed page — a capability that is far more intuitive than setting row heights or margin sizes in the Page Setup dialog. When you are producing a formatted report and the title row keeps landing on page two, Page Break Preview is the fastest fix, and it is one click away in the status bar.
Developing genuine proficiency with the Excel status bar is less about memorizing every available indicator and more about building a consistent habit of glancing at the bottom of the screen whenever you make a selection. Most Excel errors — wrong row counts, hidden totals, text-masquerading-as-numbers — announce themselves in the status bar immediately, but only for users who have trained themselves to look. Think of the status bar as a continuous passive audit that runs at zero cost the moment you highlight any range. The only question is whether you have cultivated the habit of reading it.
For those preparing for Microsoft Office Specialist (MOS) exams or similar Excel certifications, the status bar appears in questions more often than candidates expect. Exam tasks frequently instruct candidates to "verify that the selected range contains exactly 50 numeric entries" or "confirm the average of column D is approximately 78" — tasks that are trivially fast if you know to read the status bar and time-consuming if you resort to formulas. Practicing with the status bar enabled and configured correctly is therefore a direct exam preparation strategy, not just a general productivity tip.
The zoom functionality deserves one more pass from a practical angle. Many users set their workbook zoom to 85% or 90% because it allows slightly more data to be visible on screen without making text uncomfortably small. For high-density financial models with many narrow columns — the kind of models covered in depth in Excel finance training — a zoom level between 75% and 85% is standard professional practice.
The status bar zoom slider makes it trivially easy to experiment with these levels in real time. An important subtlety: the zoom level is stored per sheet, not per workbook. So setting zoom to 80% on Sheet1 does not affect Sheet2, which means you may need to configure each sheet individually for a consistent print or presentation experience.
The view mode buttons — Normal, Page Layout, and Page Break Preview — map directly to important workflow transitions that every Excel user goes through multiple times in a typical workday. Normal is the default editing mode. Page Layout is the right mode for adding headers, footers, and adjusting column widths for printing.
Page Break Preview is the right mode for controlling exactly where pages break in a long report. Many users access these through the View tab in the Ribbon, but the status bar buttons make the switch a single click from anywhere in the workbook without navigating away from the cell you are currently working in. This reduction in navigational friction adds up significantly over a day of heavy Excel use.
The inner excellence book concept of optimizing every element of your environment to support peak performance maps perfectly onto the philosophy of a well-configured Excel status bar. Just as elite performers remove friction from their physical and mental environments, skilled Excel users configure their tools to surface exactly the information they need at the moment they need it.
A status bar showing six relevant statistics, three view shortcuts, and a synchronized cloud status icon is an environment engineered for clear thinking — you spend cognitive resources on the data problem at hand, not on retrieving information that the application could display automatically.
For teams and organizations that use Excel as a shared platform — whether in accounting firms, research institutions, or operations departments — establishing a standard status bar configuration through documented onboarding guidance reduces variability in how analysts read and report on data.
If every analyst has Sum, Count, and Numerical Count enabled by default, the entire team speaks a common language when discussing aggregate checks and data quality reviews. This standardization is the kind of operational discipline that separates teams that ship reliable analysis from teams that repeatedly discover errors at the worst possible moment — in a client presentation or an executive dashboard review.
As a final practical recommendation: take five minutes today to right-click your Excel status bar and turn on every statistic you have never consciously enabled before. Live with the full set for a week and pay attention to which indicators you find yourself reading most often. Then trim back to just those three to five.
This deliberate calibration process — experiment, observe, refine — is the fastest route to a status bar configuration that actually matches your work patterns rather than one that merely reflects Excel's factory defaults. The investment is small and the return, measured in daily seconds saved and errors caught, accumulates into something genuinely significant over a professional lifetime of spreadsheet work.
Excel Questions and Answers

Excel Finance Functions Guide With PMT, NPV, IRR and Loan Models

Excel Merge Tables: The Complete 2026 Guide to Combining Data Across Worksheets

Lock Formulas in Excel: The Complete 2026 Guide to Protecting Cells, Sheets, and Workbook Calculations

Excel Data Analysis Toolpak: Complete Guide to the Analysis ToolPak Add-In

Mail Merge Labels from Excel: The Complete 2026 Guide to Printing Address Labels with Word and Excel
About the Author

Business Consultant & Professional Certification Advisor
Wharton School, University of PennsylvaniaKatherine Lee earned her MBA from the Wharton School at the University of Pennsylvania and holds CPA, PHR, and PMP certifications. With a background spanning corporate finance, human resources, and project management, she has coached professionals preparing for CPA, CMA, PHR/SPHR, PMP, and financial services licensing exams.