
CNG Map: How to Find CNG Stations Across the USA 2026 September
Use a CNG map to find compressed natural gas stations near you. Discover tools, apps, and tips for locating CNG fueling stops across the US. 🟢

Finding a reliable CNG map is one of the most practical steps any compressed natural gas driver or fleet manager can take before hitting the road. Unlike gasoline, which is available at nearly every corner store, CNG fueling stations are more selectively distributed across the country. Knowing where to find them — and how to plan routes around them — can mean the difference between a smooth trip and an unexpected stop. Whether you drive a personal CNG car or manage a fleet of delivery trucks, having accurate, up-to-date station location data is essential to daily operations.
The United States has made significant progress expanding its CNG infrastructure over the past two decades. Today, there are over 900 public CNG stations and roughly 900 private stations operating across the country, according to the U.S. Department of Energy's Alternative Fuels Station Locator. These stations are concentrated in high-demand corridors — California, Texas, Utah, Oklahoma, and the Northeast — but coverage has spread steadily into the Midwest and Southeast as fleets convert to natural gas. Understanding where gaps exist is just as important as knowing where stations thrive.
Several digital tools make it easy to visualize the national CNG station network. The DOE's Alternative Fuels Station Locator, GasBuddy, and TomTom's fleet navigation systems all provide interactive maps that can be filtered by fuel type, access type (public vs. private), and pressure rating (3,600 psi vs. 3,000 psi). Some apps even display real-time pricing, hours of operation, and user-submitted reviews. For anyone exploring cng stations map usa, these resources provide an indispensable starting point for route planning and cost management.
Fleet operators face unique challenges when using CNG maps because their vehicles often have fixed routes and strict delivery windows. A bus company running daily school routes needs to know that a fueling station is accessible at 4 a.m., not just during business hours. A long-haul freight operator needs to confirm that a station can handle a Class 8 truck and offers fast-fill capability rather than slow-fill overnight options. These operational nuances are what separate a useful CNG map from a truly great one — and why driver training on fueling logistics is so critical.
The economic argument for CNG has always been compelling, especially when diesel or gasoline prices spike. CNG typically costs 30 to 50 percent less per gasoline-gallon equivalent (GGE) than diesel, and natural gas prices have historically been less volatile than crude oil derivatives. However, those savings evaporate quickly if a driver spends an hour detouring to find an open station. That's why a thorough understanding of the CNG map — the real geographic distribution of stations — is fundamentally a cost-management issue as much as a logistics one.
Beyond individual drivers and fleet managers, municipalities and transit agencies are among the heaviest users of CNG infrastructure maps. City bus fleets in Los Angeles, Houston, and Chicago have embraced CNG en masse, building private fueling depots that don't even appear on public maps. Understanding the full landscape — public, private, and semi-public stations — gives policymakers and urban planners the data they need to invest wisely in future infrastructure. Advocacy groups regularly use CNG station density maps to lobby for expanded access in underserved regions, making this data politically relevant as well as practically useful.
This article covers everything you need to know about navigating the US CNG station map: the best tools and apps available, how to read station data correctly, regional coverage hotspots and gaps, tips for fleet route planning, and what the future of CNG infrastructure looks like as the country transitions toward cleaner energy. By the end, you'll have a clear picture of how to use the CNG map to your advantage — whether you're fueling a single vehicle or coordinating a 200-truck fleet across multiple states.
US CNG Station Network by the Numbers

Top Digital Tools for Finding CNG Stations
The U.S. Department of Energy's free web tool lets users filter stations by fuel type, access level, and EV charging. It's the most comprehensive and regularly updated database of CNG stations in the country, drawing from verified operator submissions.
Popular among consumer CNG drivers, GasBuddy combines crowd-sourced pricing with station location data. Its mobile app allows real-time filtering for CNG pumps and displays user reviews, hours of operation, and current fuel prices at thousands of locations.
Designed for commercial operators, these platforms integrate CNG station data directly into route optimization software. Drivers receive turn-by-turn directions to fueling stops that match their vehicle's pressure requirements and the fleet's fueling schedule.
The Natural Gas Vehicle America organization maintains a curated map focused specifically on NGV infrastructure. It's particularly useful for identifying semi-public stations that accept commercial accounts but aren't always listed on general fuel finders.
Regional CNG station coverage in the United States is far from uniform, and understanding these geographic patterns is critical for effective route planning. California leads the nation with more than 90 public CNG stations, driven by aggressive state incentive programs, CARB (California Air Resources Board) regulations, and a large base of CNG transit buses and refuse trucks. The LA Basin and the San Joaquin Valley are particularly well-served, reflecting both heavy commercial trucking activity and some of the nation's strictest air quality requirements. Any fleet operating west of the Sierra Nevada will find CNG access relatively straightforward.
Texas ranks second in total CNG station count, with over 70 public stations clustered around Houston, Dallas-Fort Worth, San Antonio, and along Interstate 10. The Texas CNG market is heavily influenced by the natural gas production industry itself — with abundant local supply and a strong industrial base, the economics of CNG conversion are especially favorable. Oklahoma follows a similar pattern, with a modest but well-placed network of stations along major freight corridors, benefiting from the state's status as a major natural gas producer. Fuel prices in these states are often the lowest in the country on a GGE basis.
The Northeast presents a different picture. States like New York, Pennsylvania, and Connecticut have invested significantly in CNG transit infrastructure, but public fueling access for over-the-road truckers can be spotty. Long Island, for example, has a dense cluster of stations serving the MTA bus fleet, but interstate truckers on the I-95 corridor may find gaps of 100 miles or more between public fast-fill stations. New England states have been slower to build out CNG infrastructure, though Massachusetts and Connecticut have added stations in recent years through state clean energy programs.
The Midwest represents both a challenge and an opportunity. States like Ohio, Indiana, and Illinois have growing CNG fleets — particularly in waste management and school transportation — but the public station network is less developed than in the Sun Belt states. Major hubs like Chicago, Columbus, and Indianapolis have reasonable access, but rural areas remain underserved. Fleet operators running cross-state routes through the Midwest need to plan carefully, often relying on private fueling agreements with major truck stops like Love's Travel Stops and Pilot Flying J, both of which have expanded their CNG offerings significantly since 2018.
Love's and Pilot Flying J deserve special mention in any discussion of US CNG infrastructure because they function as the backbone of the long-haul CNG trucking network. Love's operates over 100 CNG lanes at truck stops nationwide, while Pilot Flying J maintains a comparable network. These private-sector investments have done more to expand the practical CNG map for commercial truckers than almost any government program. Both chains offer fleet card programs that simplify billing and provide price transparency, making them the first choice for many national carriers running CNG-powered Kenworth, Peterbilt, or Freightliner tractors.
The Southeast — Florida, Georgia, Alabama, and the Carolinas — has historically lagged behind other regions in CNG adoption, but growth has accelerated since 2020. Florida now has over 35 public CNG stations, many of them at transit agency depots that have opened limited public access during off-peak hours. Atlanta's MARTA bus system, one of the largest CNG transit fleets in the Southeast, operates private fueling at its maintenance facilities. Advocacy from groups like the Southeast Compressed Natural Gas Collaborative has pushed several municipalities to fund new public stations along I-75 and I-95.
For fleet managers and individual drivers alike, the most practical approach to regional CNG coverage is a layered one: start with the DOE locator to identify all stations along a planned route, cross-reference with Love's or Pilot Flying J for confirmed fast-fill availability, and then set up fleet card accounts with operators in your primary coverage area.
Downloading offline maps or exporting station coordinates to a fleet management system ensures that drivers always have access to fueling data even in areas with poor cell coverage — a real consideration in states like Montana, Wyoming, and the rural Southwest where CNG infrastructure is thinnest.
CNG Station Types: Public, Private, and Semi-Public
Public CNG stations are open to any vehicle without a pre-arranged account or special access code. They typically operate 24 hours a day and offer both fast-fill dispensers (capable of fueling a vehicle in 5–10 minutes) and, at some locations, time-fill connections for overnight parking. Public stations are most common at truck stops, major highways, and urban fuel retail centers. They are listed on the DOE Alternative Fuels Station Locator and generally accept fleet cards, credit cards, or cash.
The pricing at public stations varies considerably by region and operator. In natural-gas-rich states like Texas and Oklahoma, public CNG can cost as little as $1.50 per GGE, while in the Northeast or Pacific Northwest, prices closer to $2.50 per GGE are more typical. Public stations often display the current price per GGE on a digital sign, similar to gasoline pumps, making cost comparisons straightforward for drivers managing fuel budgets on the road.

Advantages and Limitations of the US CNG Station Network
- +Over 1,800 total stations (public + private) provide broad national coverage for commercial fleets
- +Major truck stop chains like Love's and Pilot Flying J offer fast-fill at 100+ locations along key freight corridors
- +DOE and NGV America provide free, regularly updated digital maps with detailed station data
- +CNG prices are typically 30–50% lower than diesel, making station access well worth the planning effort
- +California, Texas, and Utah offer exceptionally dense public networks ideal for regional fleet operations
- +Semi-public and private stations can be accessed through fleet account agreements, expanding practical coverage significantly
- −Rural areas and much of the Southeast and Mountain West have significant coverage gaps for public CNG
- −Station hours vary widely — some public CNG pumps are not available 24/7, complicating overnight fueling plans
- −Pressure incompatibility (3,600 psi vs. 3,000 psi) can make some stations unusable for certain vehicle types
- −Fast-fill stations are less common than slow-fill, limiting options for drivers who can't wait hours to fuel
- −Real-time availability data is not always accurate — stations may be offline for maintenance without advance notice
- −CNG infrastructure requires vehicle-specific training; drivers unfamiliar with CNG nozzle types can cause costly fueling errors
CNG Route Planning Checklist for Drivers and Fleet Managers
- ✓Download the DOE Alternative Fuels Station Locator app and set fuel type filter to CNG before every long trip.
- ✓Verify station operating hours in advance — call ahead if the route requires fueling before 6 a.m. or after 10 p.m.
- ✓Confirm whether your vehicle requires 3,600 psi or 3,000 psi and filter map results accordingly.
- ✓Identify at least one backup fueling location within 50 miles of your primary planned stop.
- ✓Check if your intended station offers fast-fill or slow-fill only, and plan your schedule around fueling time.
- ✓Set up fleet card accounts with Love's CNG and Pilot Flying J before embarking on interstate routes.
- ✓Contact regional Clean Cities coalitions to identify any semi-public stations along your planned corridor.
- ✓Download offline station data or export GPS coordinates to your fleet management system before entering low-coverage areas.
- ✓Review user-submitted reviews on GasBuddy for recent station outages, pump errors, or price spikes.
- ✓Update your CNG station map data at least quarterly — infrastructure changes frequently, especially in fast-growing markets.
The DOE Locator Is Updated Weekly — Always Use the Latest Version
The U.S. Department of Energy's Alternative Fuels Station Locator is refreshed weekly with operator-submitted updates, making it the most reliable single source for US CNG station data. Bookmarking the live web version — rather than relying on cached app data — ensures you're always working from the most current station inventory, including newly opened locations and recently closed ones.
Reading CNG station data accurately is a skill that separates experienced CNG operators from newcomers. When you pull up a station entry on the DOE locator or GasBuddy, you'll typically see several data fields: access type (public, private, or card lock), fuel pressure (3,600 psi or 3,000 psi), fill type (fast-fill, slow-fill, or both), hours of operation, payment methods accepted, and sometimes a phone number for the station operator. Each of these fields has practical implications that go beyond their face value, and misreading them can lead to frustrating and costly detours.
Fuel pressure is perhaps the most technically critical field for vehicle compatibility. Nearly all light-duty CNG vehicles sold in the US since 2000 are designed for 3,600 psi systems, which is the current industry standard. Older heavy-duty vehicles, some converted fleet trucks, and certain transit buses may use the older 3,000 psi standard.
A 3,600 psi vehicle can technically fuel at a 3,000 psi station, but it will receive a partial fill — arriving with a quarter tank and leaving with about 83% capacity. Over a long route, this shortfall can strand a vehicle. Always verify pressure compatibility before committing to a fueling stop.
Fill type is equally important for operational planning. Fast-fill dispensers work like gasoline pumps: they push compressed natural gas into the vehicle's tank at high pressure, completing the fill in 5 to 15 minutes depending on tank size. Slow-fill (also called time-fill) stations use a lower-pressure connection and require 6 to 12 hours to fully charge a vehicle's tank.
Slow-fill is ideal for vehicles that are parked overnight — buses, trucks, or utility vehicles that return to a depot each evening. If you show up at a slow-fill-only station expecting a quick fuel-up during a delivery run, you'll be waiting far longer than anticipated.
Card lock stations deserve special attention because they represent a significant portion of the semi-public and private CNG network. A card lock station requires a pre-approved fleet card or access code to activate the pump. These stations often offer the most competitive per-GGE pricing because they serve contracted fleet customers rather than the general public.
Setting up card lock access with major operators — Pacific Gas & Electric in California, Questar Gas in Utah, or CenterPoint Energy in Texas — can unlock dozens of additional fueling locations that don't appear on standard public maps and come with volume discounts for high-usage fleets.
Real-time station status is one area where CNG mapping tools still lag behind gasoline apps. While GasBuddy does a reasonable job of crowd-sourcing price updates, there's no centralized system that tells you whether a specific CNG compressor is currently online and functional.
Compressor outages — caused by maintenance, power failures, or mechanical breakdowns — can take a station offline for hours or days. The best practice is to call the station directly if it's the only available option within a safe driving range, especially for vehicles that are already running low on fuel and can't afford to arrive at a non-functional pump.
Price data on CNG maps should be treated as approximate rather than definitive. CNG pricing is expressed in dollars per gasoline-gallon equivalent (GGE) or sometimes per diesel-gallon equivalent (DGE) for heavy-duty vehicles. One GGE equals approximately 5.66 pounds of CNG or 126.67 cubic feet at standard pressure. Prices fluctuate based on local natural gas commodity prices, state taxes, compressor operating costs, and market competition. California, despite having the largest CNG network, often has among the highest CNG prices due to regulatory costs, while Texas and Oklahoma typically offer the lowest prices due to abundant local supply and lighter regulatory burdens.
For fleet managers tracking fuel costs across a multi-state operation, the most rigorous approach is to export station data from the DOE locator into a spreadsheet, cross-reference with current pricing from fleet card statements, and calculate a weighted average cost per GGE by corridor. Some advanced fleet management platforms — like Fleetio or Samsara — can automate this analysis by pulling CNG price data from integrated fuel card systems and mapping it against route data. This level of data integration turns the CNG map from a simple navigation tool into a strategic cost-management asset for operations teams.

CNG compressors can go offline without warning due to mechanical failures, maintenance windows, or power outages. If a CNG station is your only fueling option within a safe driving range, call ahead to confirm the compressor is operational before detouring. Arriving at a non-functional station with a near-empty tank can leave drivers stranded in areas without roadside CNG emergency service.
The future of CNG infrastructure in the United States is being shaped by a combination of federal policy, private investment, and the evolving economics of clean energy. The Inflation Reduction Act of 2022 included provisions for alternative fuel vehicle infrastructure, and while much of the attention has focused on EV charging, CNG operators have also benefited from tax credits for refueling property under Section 30C of the tax code.
This credit allows businesses to claim up to 30% of the cost of installing CNG fueling equipment, capped at $100,000 per location, making new station development significantly more financially attractive for private investors and fleet operators building on-site fueling.
Natural gas utilities are increasingly positioning themselves as infrastructure partners for CNG station development. Companies like Atmos Energy, Spire, and NiSource have launched programs that provide discounted gas supply contracts, engineering support, and in some cases co-investment in compressor equipment for fleets willing to commit to long-term CNG purchasing agreements. These utility partnerships are particularly valuable for municipalities and school districts that want to build private fueling facilities but lack the technical expertise to design and operate a CNG compression system. The utility handles the gas supply side; the fleet operator manages the vehicles and day-to-day fueling.
Renewable natural gas (RNG) is reshaping the environmental calculus for CNG infrastructure investment. RNG — produced from landfill gas, wastewater treatment plants, and agricultural waste — is chemically identical to conventional natural gas and can be delivered through the same pipeline network and dispensed at the same CNG stations.
When a fleet fuels on RNG-sourced CNG, its lifecycle carbon intensity can actually be carbon-negative, meaning it removes more greenhouse gas from the atmosphere than it emits. California's Low Carbon Fuel Standard (LCFS) assigns high-value credits to RNG-CNG, making it economically superior to conventional diesel in that state's regulatory environment and driving rapid adoption among refuse truck and transit bus fleets.
The relationship between CNG infrastructure and battery electric vehicles (BEVs) is more complementary than competitive in the near term. Heavy-duty BEVs still face significant range limitations and lengthy charging times that make them impractical for many long-haul applications. CNG trucks, by contrast, can match diesel range (500+ miles on a single fill) and refuel in minutes at a fast-fill station.
For applications involving heavy loads, long distances, or time-sensitive deliveries — exactly the use cases where BEVs struggle — CNG will remain the dominant clean fuel alternative through at least the early 2030s. This means continued investment in CNG infrastructure is rational even as the broader energy transition accelerates.
Corridor development is a key theme in the next phase of US CNG infrastructure growth. The DOE's Alternative Fuels Corridors program has designated specific interstate routes as priority CNG corridors, encouraging private investment in new stations along highways like I-10, I-40, I-80, and I-90.
These designations come with access to federal signage programs and, in some cases, grant funding through state energy offices. Fleet operators planning network expansion should monitor which corridors receive new designations, as these announcements often precede a wave of private station construction that can transform the CNG map for a given region within 24 to 36 months.
For anyone researching the cng stations map usa landscape, it's worth noting that the data picture is becoming more dynamic, not less. New station openings, closures of older facilities, changes in access type as fleet contracts expire, and expansions of existing stations to add fast-fill capacity all happen continuously.
The most successful CNG operators — whether individual drivers or national fleet managers — treat station map data as a living resource that requires regular review, not a static reference to be consulted once and filed away. Building habits around quarterly map reviews, fleet card account maintenance, and engagement with regional Clean Cities coalitions will yield ongoing operational dividends over the life of any CNG investment.
Looking further ahead, emerging technologies like mobile CNG fueling units and small-scale virtual pipeline systems could further democratize CNG access in rural and underserved areas. Companies like J-W Power, Agility Fuel Solutions, and Fuelco Energy are developing trailer-mounted CNG stations that can be deployed at construction sites, remote fleet depots, or temporary events.
These mobile solutions won't replace the fixed station network, but they can bridge coverage gaps and provide fueling access in locations where the economics of a permanent station have never penciled out. As these technologies mature and costs decline, the CNG map of 2030 may look significantly different — and more complete — than the one drivers navigate today.
Practical tips for navigating the CNG station map effectively start with building the right toolkit before you ever start an engine. Download both the DOE Alternative Fuels Station Locator app and GasBuddy on your smartphone or fleet tablet. These two apps cover complementary data sets — the DOE locator excels at comprehensive station inventory and technical details like pressure and fill type, while GasBuddy provides crowd-sourced pricing and real-world user reviews that can reveal operational issues the official data doesn't capture. Using both together gives you a more complete picture than either alone.
For long-haul trips, the most effective planning approach is what logistics professionals call "bracketing" — identifying fueling options at regular intervals along the route rather than waiting until the tank is nearly empty. CNG vehicles typically have a range of 200 to 400 miles on a full tank, depending on vehicle type and driving conditions.
Planning a fueling stop every 150 to 200 miles ensures you always have buffer range to reach a backup station if your primary choice is unavailable. Print or save offline maps with station coordinates before entering areas with limited cell coverage, particularly in the Mountain West and rural Midwest.
Understanding GGE pricing math is essential for comparing the true cost of CNG against diesel alternatives. When a CNG pump shows $2.10 per GGE, that means you're paying $2.10 for the energy equivalent of one gallon of gasoline. To compare against diesel (which is typically priced per gallon of diesel equivalent, or DGE), multiply the GGE price by approximately 1.13 to get the DGE price.
So $2.10/GGE translates to roughly $2.37/DGE — compare that directly against the diesel price at the same truck stop to calculate your per-mile fuel cost advantage. Over hundreds of thousands of miles annually, these differences compound into significant fleet savings.
Driver training on CNG fueling protocols deserves dedicated attention, especially for fleets transitioning from diesel. CNG nozzle connections use a breakaway design that disengages safely if a vehicle drives away before the hose is disconnected — but drivers need to know how to connect the nozzle properly to avoid incomplete seals that cause fueling errors.
Drivers also need to understand the difference between fast-fill and slow-fill nozzles, how to read the vehicle's CNG pressure gauge to confirm a complete fill, and what to do if the dispenser shuts off early due to a temperature compensation issue (a common occurrence in very hot weather).
Fleet managers should also develop relationships with station operators along their primary corridors. A brief introductory call to the station manager at a key Love's or Pilot Flying J location can yield information that never makes it onto any public map: upcoming compressor maintenance windows, peak-hour congestion patterns, whether they're planning to add fast-fill lanes, and whether volume customers can negotiate preferential pricing. These human intelligence sources complement digital map tools and often provide more actionable operational insight than any app can deliver.
One often-overlooked aspect of CNG map planning is understanding the effect of altitude on fueling. CNG stations at high elevations may have reduced compression capacity during peak summer heat, meaning vehicles fueled at a mountain-region station may receive a slightly lower fill than at sea level. Drivers running routes through Colorado, Utah, or the Sierra Nevada should account for this by targeting fuller tanks before ascending and identifying lower-elevation backup stations on descending routes. This is a nuanced operational detail that most CNG training programs don't cover but that experienced drivers learn quickly through real-world experience.
Finally, staying current with CNG infrastructure news is a low-effort habit that pays consistent dividends for active CNG operators. NGV America publishes regular updates on new station openings, policy changes affecting CNG infrastructure investment, and regional market developments. The DOE's Clean Cities program sends email newsletters with station locator updates and funding opportunity announcements. Following these sources takes less than 30 minutes per month but ensures that your operational CNG map stays as current and accurate as possible — and that you're positioned to take advantage of new fueling options as soon as they become available in your operating region.
CNG Questions and Answers

What Is CNG Gas? A Complete Guide to Compressed Natural Gas for US Drivers and Fleets

CNG Jobs: Careers in the Compressed Natural Gas Industry
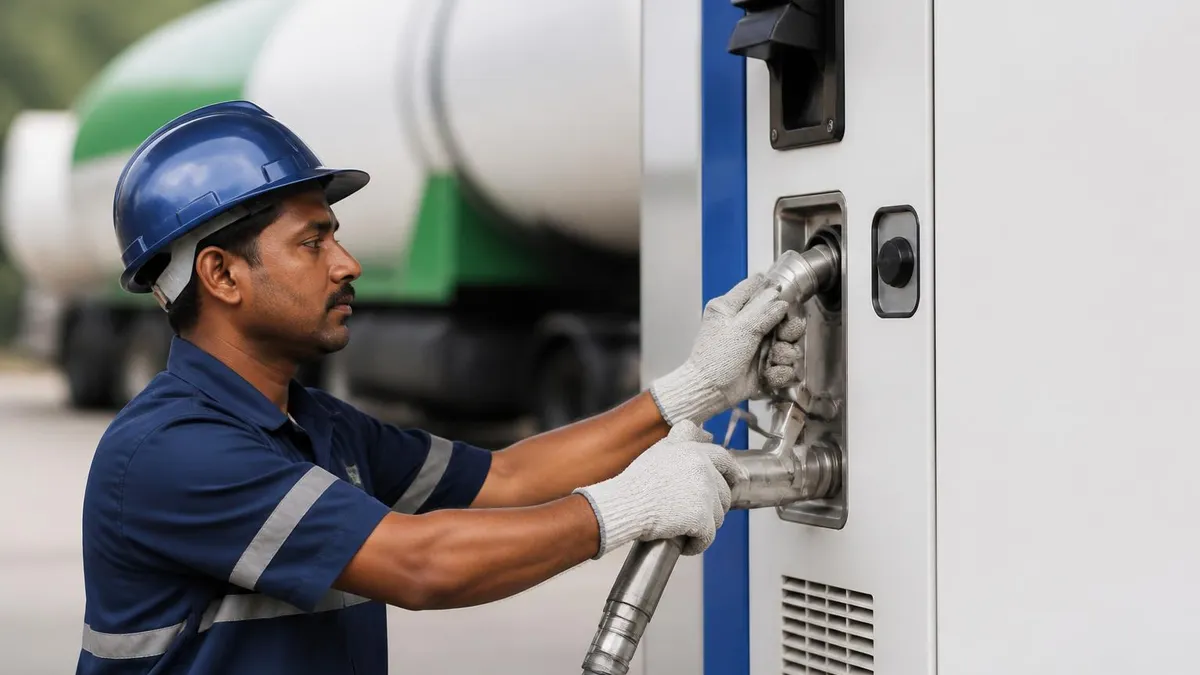
CNG Trucks for Sale: Complete Buyer's Guide to New and Used Compressed Natural Gas Vehicles

CNG Fuel Injectors: How They Work, Types, Maintenance, and What Every Fleet Owner Needs to Know
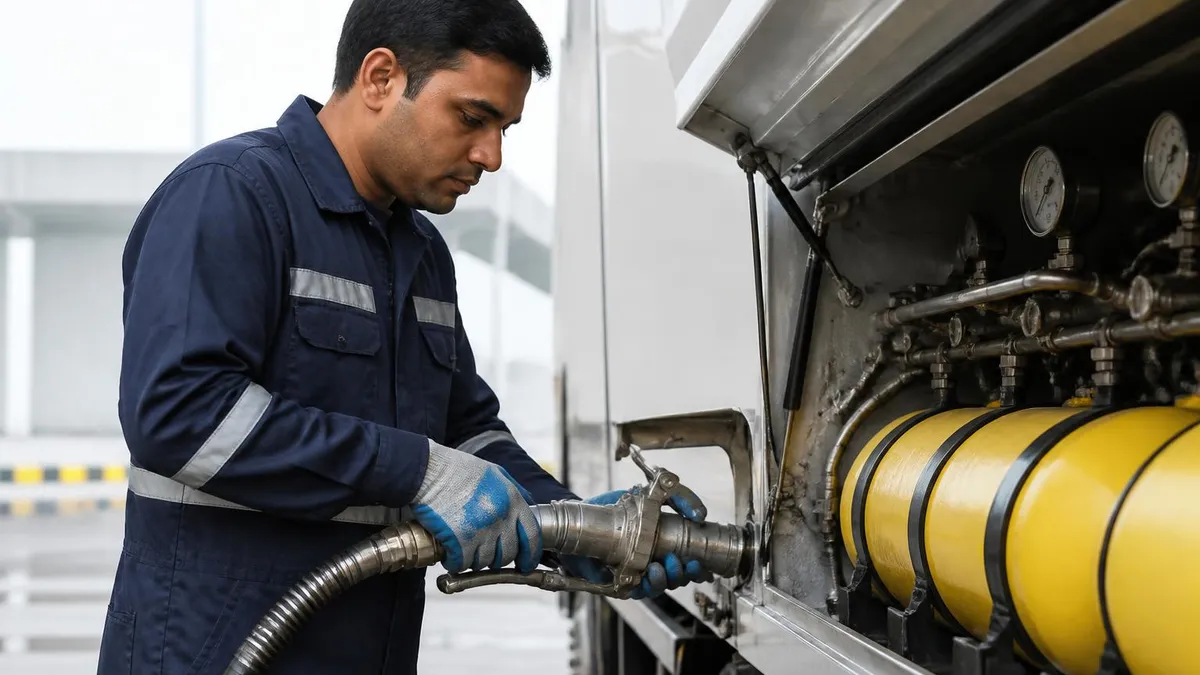
CNG Car: How Compressed Natural Gas Vehicles Work, Benefits, Costs, Available Models, and Safety
About the Author

Educational Psychologist & Academic Test Preparation Expert
Columbia University Teachers CollegeDr. Lisa Patel holds a Doctorate in Education from Columbia University Teachers College and has spent 17 years researching standardized test design and academic assessment. She has developed preparation programs for SAT, ACT, GRE, LSAT, UCAT, and numerous professional licensing exams, helping students of all backgrounds achieve their target scores.
Join the Discussion
Connect with other students preparing for this exam. Share tips, ask questions, and get advice from people who have been there.
View discussion (8 replies)