Math Questions Calculator Permitted Exam 1
A system of three equations and their graphs in the xy-plane are shown above. How many solutions does the system have?
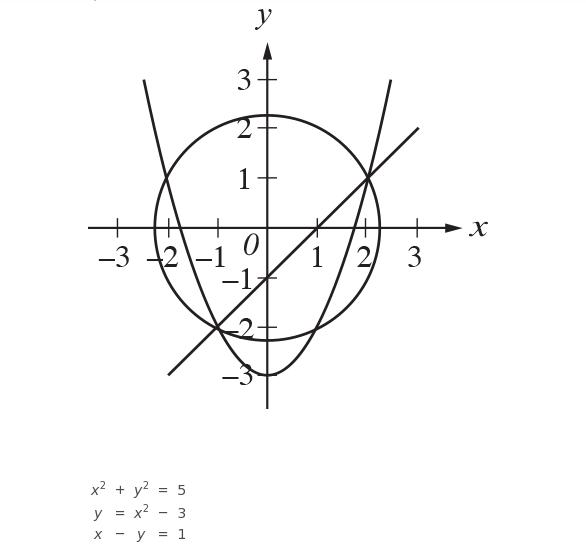
Choice B is correct. The solutions to the system of equations are the points where the circle, parabola, and line all intersect. These points are open parentheses minus 1 comma 2 close parentheses and left parenthesis 2 comma 1 right parenthesis, and these are the only solutions to the system. Choice A is not the correct answer. This answer may reflect the misconception that a system of equations can have only one solution. Choice C is not the correct answer. This answer may reflect the misconception that a system of equations has as many solutions as the number of equations in the system. Choice D is not the correct answer. This answer may reflect the misconception that the solutions of the system are represented by the points where any two of the curves intersect, rather than the correct concept that the solutions are represented only by the points where all three curves intersect.
At a primate reserve, the mean age of all the male primates is 15 years, and the mean age of all female primates is 19 years. Which of the following must be true about the mean age m of the combined group of male and female primates at the primate reserve?


Choice D is correct. The student must reason that because the mean of the males is lower than that of the females, the combined mean cannot be greater than or equal to that of the females, while also reasoning that because the mean of the females is greater than that of the males, the combined mean cannot be less than or equal to the mean of the males. Therefore the combined mean must be between the two separate means. Choice A is not the correct answer. This answer results from a student finding the mean of the two means. This answer makes an unjustified assumption that there are an equal number of male and female primates. Choice B is not the correct answer. This answer results from a student finding the mean of the two means and misapplying an inequality to the scenario. This answer makes an unjustified assumption that there are more females than males. Choice C is not the correct answer. This answer results from a student finding the mean of the two means and misapplying an inequality to the scenario. This answer makes an unjustified assumption that there are more males than females.
If - 9 over 5 < - 3t + 1 < - 7 over 4, what is one possible value of 9t - 3 ?
Any value greater than 21 over 4 and less than 27 over 5 Recognizing the structure of this inequality provides one solution strategy. With this strategy, a student will look at the relationship between -3t + 1 and 9t -3 and recognize that the latter is −3 multiplied by the former. Multiplying all parts of the inequality by −3 reverses the inequality signs, resulting in 27 over 5 > 9t - 3 > 21 over 4 , or rather 21 over 4 < 9t - 3 < 27 over 5 when written with increasing values from left to right. Any value greater than 21 over 4 and less than 27 over 5 is correct.
A survey was conducted among a randomly chosen sample of U.S. citizens about U.S. voter participation in the November 2012 presidential election. The table below displays a summary of the survey results. A survey was conducted among a randomly chosen sample of U.S. citizens about U.S. voter participation in the November 2012 presidential election. The table below displays a summary of the survey results.
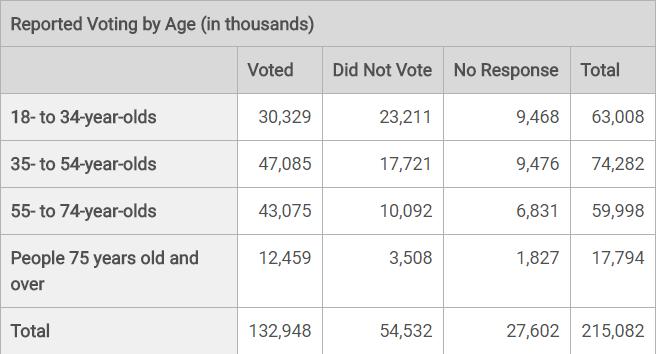
Choice D is the correct answer. This question asks students to extrapolate from a random sample to estimate the number of 18- to 34-year-olds who voted for Candidate A: this is done by multiplying the fraction of people in the random sample who voted for Candidate A by the total population of voting 18- to 34-year-olds: 287 over 500 x 30,329,000 almost equal to 17 million , choice D. Students without a clear grasp of the context and its representation in the table might easily arrive at one of the other answers listed. Choice A is not the correct answer. The student may not have multiplied the fraction of the sample by the correct subgroup of people (18- to 34-year-olds who voted). This answer may result from multiplying the fraction by the entire population, which is an incorrect application of the information. Choice B is not the correct answer. The student may not have multiplied the fraction of the sample by the correct subgroup of people (18- to 34-year-olds who voted). This answer may result from multiplying the fraction by the total number of people who voted, which is an incorrect application of the information. Choice C is not the correct answer. The student may not have multiplied the fraction of the sample by the correct subgroup of people (18- to 34-year-olds who voted). This answer may result from multiplying the fraction by the total number of 18- to 34-year-olds, which is an incorrect application of the information.
A survey was conducted among a randomly chosen sample of U.S. citizens about U.S. voter participation in the November 2012 presidential election. The table below displays a summary of the survey results. According to the table, for which age group did the greatest percentage of people report that they had voted?
Choice C is the correct answer. The first question asks students to select the relevant information from the table to compute the percentage of self-reported voters for each age group and then compare the percentages to identify the largest one, choice C. Of the 55- to 74-year-old group’s total population (59,998,000), 43,075,000 reported that they had voted, which represents 71.8% and is the highest percentage of reported voters from among the four age groups. Choice A is not the correct answer. The question is asking for the age group with the largest percentage of self-reported voters. This answer reflects the age group with the smallest percentage of self-reported voters. This group’s percentage of self-reported voters is 48.1%, or fraction numerator 30 comma 329 over denominator 63 comma 008 end fraction, which is less than that of the 55- to 74-year-old group. Choice B is not the correct answer. The question is asking for the age group with the largest percentage of self-reported voters. This answer reflects the age group with the largest number of self-reported voters, not the largest percentage. This group’s percentage of self-reported voters is 63.4%, or 47 ,085 over 74,282, which is less than that of the 55- to 74-year-old group. Choice D is not the correct answer. The question is asking for the age group with the largest percentage of self-reported voters. This answer reflects the age group with the smallest number of self-reported voters, not the largest percentage. This group’s percentage of self-reported voters is 70.0%, or 12 ,459 over 17,794 which is less than that of the 55- to 74-year-old group.
A company’s manager estimated that the cost C, in dollars, of producing n items is C equals 7 n plus 350. The company sells each item for $12. The company makes a profit when total income from selling a quantity of items is greater than the total cost of producing that quantity of items. Which of the following inequalities gives all possible values of n for which the manager estimates that the company will make a profit?


Choice C is correct. One method to find the correct answer is to create an inequality. The income from sales of n items is 12n. For the company to profit, 12n must be greater than the cost of producing n items; therefore, the inequality 12n >7n + 350 can be used to model the context. Solving this inequality yields n> 70. Choice A is not the correct answer. This answer may result from a misunderstanding of the properties of inequalities. The student may have found the number of items of the break-even point as 70 and used the incorrect notation to express the answer, or the student may have incorrectly modeled the scenario when setting up an inequality to solve. Choice B is not the correct answer. This answer may result from a misunderstanding of how the cost equation models the scenario. A student who uses the cost of $12 as the number of items n and evaluates the expression 7n will find the value of 84. A student who does not understand how the inequality relates to the scenario may think n should be less than this value. Choice D is not the correct answer. This answer may result from a misunderstanding of how the cost equation models the scenario. A student who uses the cost of $12 as the number of items n and evaluates the expression 7n will find the value of 84. A student who does not understand how the inequality relates to the scenario may think n should be greater than this value.
A biology class at Central High School predicted that a local population of animals will double in size every 12 years. The population at the beginning of 2014 was estimated to be 50 animals. If P represents the population n years after 2014, then which of the following equations represents the class’s model of the population over time?


Choice D is correct. The student first recognizes that a population that doubles in size over equal time periods is increasing at an exponential rate. An exponential growth model can be written in the form y = ( 2 ) to the power of x over b where a is the population at time 0, since 2 raised to the zeroth power is 1 and b is the doubling time, since when x =12 , 2 is raised to the first power, and the population will be 2 to the power of 1 x a = 2a. From the way the variables were defined, the population at time n equals 0 is 50 and the doubling time is 12. Choice A is not the correct answer. This answer may result from a misunderstanding of exponential equations or of the context. A student who tries to model the scenario with a linear equation or who misunderstands that the y-intercept of a linear model should represent the initial number of animals may produce this equation. Choice B is not the correct answer. This answer may result from a misunderstanding of exponential equations or of the scenario. A student who tries to model the scenario with a linear equation may produce this equation. Choice C is not the correct answer. A student who tries to produce an exponential model, but does not understand how the 12 years affects the model, may incorrectly write the exponent.
A researcher wanted to know if there is an association between exercise and sleep for the population of 16-year-olds in the United States. She obtained survey responses from a random sample of 2000 United States 16-year-olds and found convincing evidence of a positive association between exercise and sleep. Which of the following conclusions is well supported by the data?
Choice A is correct. A relationship in the data can only be generalized to the population that the sample was drawn from. Choice B is not the correct answer. A relationship in the data can only be generalized to the population that the sample was drawn from. The sample was from high school students in the United States, not from high school students in the entire world. Choice C is not the correct answer. Evidence for a cause-and-effect relationship can only be established when participants are randomly assigned to groups that receive different treatments. Choice D is not the correct answer. Evidence for a cause-and-effect relationship can only be established when participants are randomly assigned to groups that receive different treatments. Also, a relationship in the data can only be generalized to the population that the sample was drawn from. The sample was from high school students in the United States, not from high school students in the entire world.
A research assistant randomly selected 75 undergraduate students from the list of all students enrolled in the psychology-degree program at a large university. She asked each of the 75 students, “How many minutes per day do you typically spend reading?” The mean reading time in the sample was 89 minutes, and the margin of error for this estimate was 4.28 minutes. Another research assistant intends to replicate the survey and will attempt to get a smaller margin of error. Which of the following samples will most likely result in a smaller margin of error for the estimated mean time students in the psychology-degree program read per day?
Choice A is not the correct answer. This answer may result from a misunderstanding of the importance of sample size to a margin of error. The margin of error is likely to increase with a smaller sample size. Choice B is not the correct answer. This answer may result from a misunderstanding of the importance of sample size and participant selection to a margin of error. The margin of error is likely to increase due to the smaller sample size. Also undergraduate students from all degree programs at the college is a different population than the original survey and therefore the impact to the mean and margin of error cannot be predicted. Choice D is not the correct answer. Undergraduate students from all degree programs at the college is a different population than the original survey and therefore the impact to the mean and margin of error cannot be predicted.
The table below classifies 103 elements as metal, metalloid, or nonmetal and as solid, liquid, or gas at standard temperature and pressure. What fraction of all solids and liquids in the table are metalloids?
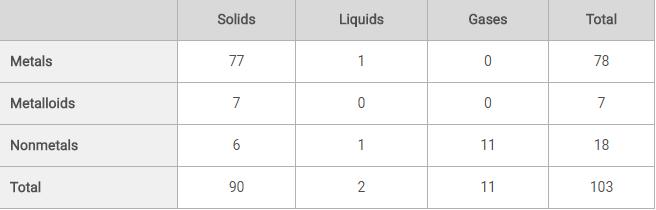
There are 7 metalloids that are solid or liquid, and there are 92 total solids and liquids. Therefore, the fraction of solids and liquids that are metalloids is 7 over 92.
Aaron is staying at a hotel that charges $99.95 per night plus tax for a room. A tax of 8% is applied to the room rate, and an additional onetime untaxed fee of $5.00 is charged by the hotel. Which of the following represents Aaron’s total charge, in dollars, for staying x nights?


Choice B is correct. The total charge that Aaron will pay is the room rate, the 8% tax on the room rate, and a fixed fee. If Aaron stayed x nights, then the total charge is ( 99.95 x + 0.08 x 99.95 x ) + 5, which can be rewritten as 1.08 (99.95 x ) + 5. Choice A is not the correct answer. The expression includes only one night stay in the room and does not accurately account for tax on the room. Choice C is not the correct answer. The expression includes tax on the fee, and the hotel does not charge tax on the $5.00 fee. Choice D is not the correct answer. The expression includes tax on the fee and a fee charge for each night.
The first metacarpal bone is located in the wrist. The scatterplot below shows the relationship between the length of the first metacarpal bone and height for 9 people. The line of best fit is also shown.Which of the following is the best interpretation of the slope of the line of best fit in the context of this problem?
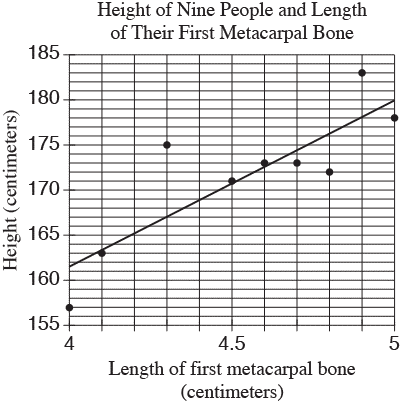
Choice A is correct. The slope is the change in the vertical distance divided by the change in the horizontal distance between any two points on a line. In this context, the change in the vertical distance is the change in the predicted height of a person, and the change in the horizontal distance is the change in the length of his or her first metacarpal bone. The unit rate, or slope, is the increase in predicted height for each increase of 1 centimeter of the first metacarpal bone. Choice B is not the correct answer. Students who select this answer may have interpreted slope incorrectly as run over rise. Choice C is not the correct answer. Students who select this answer may have mistaken slope for the y-intercept. Choice D is not the correct answer. Students who select this answer may have mistaken slope for the x-intercept.
The first metacarpal bone is located in the wrist. The scatterplot below shows the relationship between the length of the first metacarpal bone and height for 9 people. The line of best fit is also shown. Based on the line of best fit, what is the predicted height for someone with a first metacarpal bone that has a length of 4.45 centimeters?
Choice C is correct. Students must see that the scale of the x-axis is 0.1, and therefore the x-value of 4.45 is halfway between the unmarked value of 4.4 and the marked value of 4.5. The student must then find the y-value on the line of best fit that corresponds with an x-value of 4.45, which is 170. Choice A is not the correct answer. A student who mistakenly finds the point on the line between the x-values of 4.3 and 4.4 will find a predicted metacarpal bone length of 168 centimeters. Choice B is not the correct answer. A student who mistakenly finds the point on the line that corresponds with an x-value of 4.4 centimeters will find a predicted height of approximately 169 centimeters. Choice D is not the correct answer. A student who mistakenly finds the point on the line that corresponds with an x-value of 4.5 centimeters will find a predicted height of approximately 171 centimeters. Students might also choose this option if they mistakenly use the data point that has an x-value closest to 4.45 cm.
The recommended daily calcium intake for a 20-year-old is 1,000 milligrams (mg). One cup of milk contains 299 mg of calcium and one cup of juice contains 261 mg of calcium. Which of the following inequalities represents the possible number of cups of milk m and cups of juice j a 20-year-old could drink in a day to meet or exceed the recommended daily calcium intake from these drinks alone?


Choice A is correct. Multiplying the number of cups of milk by the amount of calcium each cup contains and multiplying the number of cups of juice by the amount of calcium each cup contains gives the total amount of calcium from each source. The student must then find the sum of these two numbers to find the total amount of calcium. Because the question asks for the calcium from these two sources to meet or exceed the recommended daily intake, the sum of these two products must be greater than or equal to 1,000. Choice B is not the correct answer. This answer may result from a misunderstanding of the meaning of inequality symbols as they relate to real-life situations. This answer does not allow for the daily intake to meet the recommended daily amount. Choice C is not the correct answer. This answer may result from a misunderstanding of proportional relationships. Here the wrong operation is applied, with the total amount of calcium per cup divided by the number of cups of each type of drink. These values should be multiplied. Choice D is not the correct answer. This answer may result from a combination of mistakes. The inequality symbol used allows the option to exceed, but not to meet, the recommended daily value, and the wrong operation may have been applied when calculating the total amount of calcium intake from each drink.
The first metacarpal bone is located in the wrist. The scatterplot below shows the relationship between the length of the first metacarpal bone and height for 9 people. The line of best fit is also shown.How many of the nine people have an actual height that differs by more than 3 centimeters from the height predicted by the line of best fit?
Choice B is correct. The people who have first metacarpal bones of length 4.0, 4.3, 4.8, and 4.9 centimeters have heights that are greater than 3 centimeters different from the height predicted by the line of best fit. Choice A is not the correct answer. There are 2 people whose actual heights are more than 3 centimeters above the height predicted by the line of best fit. However, there are also 2 people whose actual heights are farther than 3 centimeters below the line of best fit. Choice C is not the correct answer. There are 6 data points in which the absolute value of the between the actual height and the height predicted by the line of best fit is greater than 1 centimeter. Choice D is not the correct answer. The data on the graph represents 9 different people; however, the absolute value of the difference between actual height and predicted height is not greater than 3 for all of the people.