
Excel Python: The Complete 2026 September Guide to Running Python Inside Microsoft Excel
Learn how Excel Python works in 2026 September—run pandas in cells, automate VLOOKUP Excel tasks, and analyze data faster with this complete beginner guide. 🔎

Excel Python is one of the biggest changes to spreadsheets in decades, and it lets you write real Python code directly inside a worksheet cell instead of being limited to traditional formulas. Microsoft introduced this feature so analysts could blend the familiar grid layout of Excel with the data-science power of libraries like pandas, NumPy, and Matplotlib. If you already know basic formulas, learning excel python is the natural next step toward serious automation, advanced charts, and reproducible analysis that scales far beyond what a single formula can do.
It is worth understanding why so much excitement surrounds this tool. For years, people who wanted heavy analytics had to export data into a separate Python environment, run scripts, and paste results back into Excel. That round trip was slow and error prone. With Python in Excel, the code runs securely in the Microsoft cloud and returns the output straight into your grid, so your spreadsheet becomes a living analysis document rather than a static table of numbers that someone copied in by hand.
Search trends show people look up everything from inner excellence book reviews to resort names like excellence playa mujeres, but the Excel community keeps asking practical questions: how do I clean messy data, how do I chart trends, and how do I automate repetitive reports? Excel Python answers all three. You can load a dataset once, transform it with a few lines of pandas, and refresh it on demand, which removes the manual cleanup that eats up hours of every analyst's week.
This guide is written for US readers who already use Excel daily but have never touched code. We will cover what the feature is, how to turn it on, what it costs, and where it beats classic functions. You do not need a computer science degree to follow along. If you can write a SUM formula and understand rows and columns, you have more than enough background to start writing small, useful Python snippets in your own files this week.
We will also keep things honest. Excel Python is powerful, but it is not the right tool for every job. Simple lookups, quick totals, and small tables are still faster with native functions. Knowing when to reach for Python and when to stick with a formula like VLOOKUP is part of becoming a confident analyst, and this article gives you a clear framework so you never overcomplicate a task that a single cell could handle in seconds.
By the end, you will understand the setup process, the security model, the most useful libraries, and a realistic learning path. You will see side-by-side comparisons, a checklist you can follow today, and answers to the questions beginners ask most. Whether your goal is faster monthly reports, cleaner dashboards, or a resume that stands out, mastering excel python in 2026 puts a genuinely modern skill in your toolkit without forcing you to abandon the spreadsheet you already love.
Think of this page as a friendly on-ramp rather than a dense manual. We move step by step, define every term the first time it appears, and point you toward free practice along the way so the ideas stick. Spreadsheets are not going anywhere, and adding code to them only widens what you can build, so let us start by looking at the numbers behind this fast-growing feature.
Excel Python by the Numbers

How to Enable Python in Excel
Confirm Your Subscription
Open the Formulas Tab
Type =PY( to Start
Reference Your Data
Run With Ctrl+Enter
So what does excel python actually do once it is turned on? At its core, it lets you treat a block of spreadsheet cells as a structured dataset and then manipulate that dataset with the same tools professional data scientists use every day. Instead of dragging a formula down ten thousand rows, you write one line that describes the transformation, and Python applies it to the entire dataset at once. This shift from cell-by-cell thinking to whole-table thinking is the mental leap that makes the feature so productive.
The most common starting point is data cleaning. Real spreadsheets are messy: extra spaces, inconsistent dates, duplicate rows, and blank cells everywhere. With a few pandas commands you can strip whitespace, standardize date formats, drop duplicates, and fill missing values in seconds. Doing the same work with native functions and manual sorting could take an hour and still leave mistakes behind, so this single use case justifies the learning curve for most analysts who handle imported data regularly.
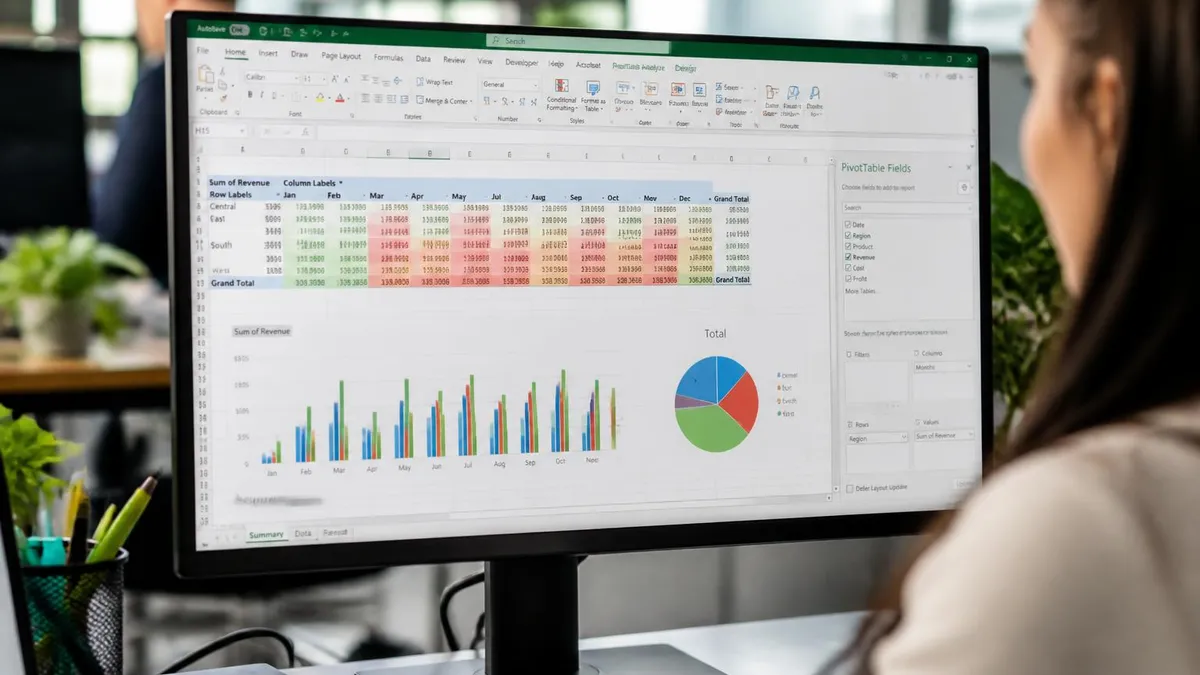
Next comes summarizing and grouping. Pivot tables are fantastic, but Python group-by operations are more flexible because you can chain several steps together and document exactly what happened. You might group sales by region, calculate a rolling average, and rank the results all in one connected block of code. When a manager asks how you produced a number, you can point to readable lines rather than trying to remember which buttons you clicked in a menu three weeks ago.
Visualization is another standout area. Excel charts are good, but Matplotlib and Seaborn give you publication-quality plots, heat maps, and statistical charts that the built-in tools cannot match. Because the chart is generated by code, you can regenerate it instantly whenever the underlying numbers change. That reproducibility matters enormously for monthly reporting, where the same template must run again and again with fresh data and zero manual reformatting each cycle.
Excel Python also opens the door to genuine statistics and forecasting. You can run regressions, build correlation matrices, and even fit simple machine-learning models without leaving the workbook. For a small business owner forecasting next quarter's demand, this means modern analytics live right beside the invoices and budgets already stored in the file. There is no separate program to learn and no exporting data to a tool that the rest of the team cannot open.
Finally, it works alongside everything you already know. You can still use VLOOKUP, build a dashboard, and apply conditional formatting on the same sheet. Python results spill into cells like any other output, so downstream formulas keep working normally. This blend is the whole point: you are not replacing Excel, you are extending it. The grid stays your home base while Python quietly handles the heavy lifting that formulas were never designed to do.
If you are unsure whether a task needs Python, ask one question: would this require dozens of helper columns or a repeated manual process? If yes, code will likely save time. If it is a quick total or a single lookup, stay with a formula. That simple test keeps your workbooks clean and stops you from over-engineering problems that the spreadsheet already solves elegantly.

Microsoft Excel Practice Test Questions
Prepare for the Microsoft Excel exam with our free practice test modules. Each quiz covers key topics to help you pass on your first try.
Microsoft Excel Excel Basic and Advance
Microsoft Excel Exam Questions covering Excel Basic and Advance. Master Microsoft Excel Test concepts for certification prep.
Microsoft Excel Excel Formulas
Free Microsoft Excel Practice Test featuring Excel Formulas. Improve your Microsoft Excel Exam score with mock test prep.
Microsoft Excel Excel Functions
Microsoft Excel Mock Exam on Excel Functions. Microsoft Excel Study Guide questions to pass on your first try.
Microsoft Excel Excel MCQ
Microsoft Excel Test Prep for Excel MCQ. Practice Microsoft Excel Quiz questions and boost your score.
Microsoft Excel Excel
Microsoft Excel Questions and Answers on Excel. Free Microsoft Excel practice for exam readiness.
Microsoft Excel Excel Trivia
Microsoft Excel Mock Test covering Excel Trivia. Online Microsoft Excel Test practice with instant feedback.
Microsoft Excel Advanced Data Analysis Tools
Free Microsoft Excel Quiz on Advanced Data Analysis Tools. Microsoft Excel Exam prep questions with detailed explanations.
Microsoft Excel Advanced Formula and Macro...
Microsoft Excel Practice Questions for Advanced Formula and Macro Creation. Build confidence for your Microsoft Excel certification exam.
Microsoft Excel Advanced Formulas and Macros
Microsoft Excel Test Online for Advanced Formulas and Macros. Free practice with instant results and feedback.
Microsoft Excel Basic and Advance Question...
Microsoft Excel Study Material on Basic and Advance Questions and Answers. Prepare effectively with real exam-style questions.
Microsoft Excel Creating and Managing Charts
Free Microsoft Excel Test covering Creating and Managing Charts. Practice and track your Microsoft Excel exam readiness.
Microsoft Excel Data Visualization with Ch...
Microsoft Excel Exam Questions covering Data Visualization with Charts. Master Microsoft Excel Test concepts for certification prep.
Microsoft Excel Formulas and Functions
Free Microsoft Excel Practice Test featuring Formulas and Functions. Improve your Microsoft Excel Exam score with mock test prep.
Microsoft Excel Formulas and Functions App...
Microsoft Excel Mock Exam on Formulas and Functions Application. Microsoft Excel Study Guide questions to pass on your first try.
Microsoft Excel Formulas Questions and Ans...
Microsoft Excel Test Prep for Formulas Questions and Answers. Practice Microsoft Excel Quiz questions and boost your score.
Microsoft Excel Functions Questions and An...
Microsoft Excel Questions and Answers on Functions Questions and Answers. Free Microsoft Excel practice for exam readiness.
Microsoft Excel Managing Data Cells and Ra...
Microsoft Excel Mock Test covering Managing Data Cells and Ranges. Online Microsoft Excel Test practice with instant feedback.
Microsoft Excel Managing Tables and Data
Free Microsoft Excel Quiz on Managing Tables and Data. Microsoft Excel Exam prep questions with detailed explanations.
Microsoft Excel Managing Tables and Table ...
Microsoft Excel Practice Questions for Managing Tables and Table Data. Build confidence for your Microsoft Excel certification exam.
Microsoft Excel Managing Worksheets and Wo...
Microsoft Excel Test Online for Managing Worksheets and Workbooks. Free practice with instant results and feedback.
Microsoft Excel MCQ Questions and Answers
Microsoft Excel Study Material on MCQ Questions and Answers. Prepare effectively with real exam-style questions.
Microsoft Excel Questions and Answers
Free Microsoft Excel Test covering Questions and Answers. Practice and track your Microsoft Excel exam readiness.
Excel Python vs VLOOKUP Excel
VLOOKUP excel remains the fastest way to pull one matching value from a reference table. If a coworker sends a price list and you need the price for a single product code, a lookup formula returns it instantly with no setup. It works on every version of Excel, including offline desktop files, and most colleagues already understand it, which makes shared workbooks easier to maintain and audit.
Lookups also shine for small, stable tables that rarely change. A tax rate by state, a shipping fee by zip code, or an employee name by ID are perfect lookup jobs. There is no reason to invoke Python for these because the formula is shorter, transparent, and recalculates automatically whenever the source data updates inside the same workbook.
Is Excel Python Worth Learning?
- +Runs powerful pandas and NumPy analysis without leaving the familiar grid
- +No local installation because code executes securely in the Microsoft cloud
- +Creates reproducible reports that refresh instantly with new data
- +Produces advanced charts with Matplotlib and Seaborn beyond native options
- +Handles huge or messy datasets that overwhelm traditional formulas
- +Adds a modern, resume-worthy skill that pairs with existing Excel knowledge
- −Requires an eligible Microsoft 365 subscription on the current channel
- −Internet connection is needed because computation happens in the cloud
- −Steeper learning curve than basic formulas for true beginners
- −Overkill for simple totals, single lookups, and small tables
- −Some legacy or offline workbooks will not support the feature
- −Cloud execution can feel slower than instant native recalculation
Excel Python Beginner Setup Checklist
- ✓Confirm you have an eligible Microsoft 365 subscription on the current channel.
- ✓Update Excel to the latest build through Account settings.
- ✓Locate the Insert Python button on the Formulas ribbon.
- ✓Type =PY( in a cell to switch it into Python mode.
- ✓Use xl() to pull a range or table into a pandas DataFrame.
- ✓Set headers=True so column names import correctly.
- ✓Run code with Ctrl plus Enter and review the returned object.
- ✓Choose whether results spill into cells or stay as a Python object.
- ✓Save your workbook to OneDrive or SharePoint for reliable cloud execution.
- ✓Practice cleaning one messy dataset before building a full report.
Start small and let one win build the next
You do not need to master Python before it becomes useful. Learn three things first: how to import a range with xl(), how to clean it with pandas, and how to summarize it. Those three skills alone replace hours of manual work and give you the confidence to keep going.
Once your environment is ready, the next step is understanding the core libraries that make excel python so capable. The three you will use constantly are pandas for tables, NumPy for fast math on arrays, and Matplotlib for charts. Microsoft bundles these and many more so you never have to install anything yourself. Knowing what each one is for keeps your code focused and prevents the common beginner mistake of searching for a complicated solution when a single built-in function already exists.
Pandas is the workhorse. Its central object, the DataFrame, is essentially a smart table with labeled rows and columns, which maps perfectly onto how you already think about a worksheet. With pandas you filter rows, create calculated columns, group and aggregate, and merge multiple tables on shared keys. If you have ever wished a pivot table could remember its exact steps and rerun them automatically, a few lines of pandas grouping code deliver precisely that, with full documentation built right into the cell.
NumPy sits underneath pandas and handles raw numerical speed. Most beginners use it indirectly, but it becomes valuable when you need vectorized math across large arrays, random sampling for simulations, or linear algebra for modeling. Because NumPy operates on whole arrays at once, calculations that would crawl as formulas finish almost instantly. You rarely call it directly at first, yet understanding that it powers the math helps you reason about why Python handles big datasets so gracefully.
For visualization, Matplotlib gives you precise control over every element of a chart, while Seaborn layers on attractive statistical defaults. You can build line charts that track trends, scatter plots that reveal relationships, and heat maps that expose patterns hidden in a dense table. Because the chart is produced by code, regenerating it after a data refresh takes zero extra clicks, which is a genuine advantage when you publish the same report on a fixed monthly schedule.
A typical workflow ties these together in a clear sequence. First you import the raw range into a DataFrame, then you clean it by removing duplicates and fixing data types, then you reshape it through grouping or merging, and finally you either output a tidy table back into the grid or render a chart. Following this consistent pattern keeps your notebooks readable and makes troubleshooting far easier when a result looks wrong and you need to find the step that caused it.
It also helps to keep each Python cell focused on one job. Rather than writing one enormous block, break the process across several cells so you can inspect intermediate results. This mirrors good spreadsheet habits, where you check totals at each stage instead of trusting one giant formula. Modular cells make collaboration smoother too, because a teammate can understand and adjust a single step without untangling everything you wrote in a single dense statement.
As you grow more comfortable, you will discover specialized libraries for finance, dates, and statistics that slot neatly into the same workflow. The beauty of the system is that the foundation never changes: import, clean, reshape, output. Master that rhythm with pandas, NumPy, and Matplotlib, and almost every new task becomes a variation on a pattern you already know rather than a brand-new puzzle you have to solve from scratch.
Python in Excel runs your code in the Microsoft cloud, not on your local machine, so an internet connection is required and your data travels to secure Microsoft servers for processing. Before using it with sensitive or regulated information, confirm your organization's data-handling policies and check that cloud computation is approved for that content.
Beyond the basics, excel python rewards a steady, project-based learning approach rather than trying to memorize every command at once. The fastest progress comes from picking one real task you already do manually and rebuilding it with code. Maybe that is a weekly sales summary, a budget variance report, or a customer list that always arrives messy. Solving a genuine problem keeps you motivated and teaches the exact commands you need instead of abstract examples you will quickly forget.
A smart first project is automating data cleanup. Take a file you receive regularly and write a short script that trims spaces, standardizes dates, removes duplicate rows, and renames columns to a consistent style. Once it works, you can rerun it on next week's file in seconds. This single automation often saves more time than any other Excel skill you have learned, and it builds the pandas fluency you will lean on for everything that follows.
From there, layer in summarization. Group your cleaned data by a meaningful category, calculate totals and averages, and rank the results. Compare the Python output to a pivot table you trust to confirm the numbers match. This verification habit is essential, because trusting code you have not checked is how silent errors slip into reports. Validate early and often, and your confidence in the results will grow alongside your technical ability.
When you are ready for visualization, recreate one chart you currently build by hand. Generating it with Matplotlib teaches you how plotting works and immediately demonstrates the reproducibility payoff. The next time the underlying data changes, your chart updates by simply rerunning the cell. Small wins like this compound quickly, and within a few weeks you will reach for Python naturally whenever a task feels repetitive or fiddly with formulas alone.
Do not neglect your formula skills while learning Python, because the strongest analysts fluently switch between both. Continue practicing native functions, conditional formatting, and lookups, since these remain the right choice for quick, interactive work. The goal is a balanced toolkit where you instinctively know which approach fits each job. Treat Python as a powerful addition to your existing knowledge, not a replacement that makes everything you already learned obsolete.
Finally, lean on free practice and a supportive community. Work through quiz questions to reinforce concepts, read example notebooks others have shared, and keep a personal snippet file of code you use often. Documentation and forums answer most questions within minutes, and revisiting your own past solutions accelerates new projects. Consistent, hands-on repetition turns scattered knowledge into reliable skill that you can demonstrate confidently in any analytical role.
If you ever feel stuck, return to the simple import-clean-reshape-output rhythm and break the problem into smaller cells. Most beginner frustration comes from attempting too much in one block. Patience and small steps win here, just as they do when you first learned spreadsheets. Give yourself a few focused weeks, and Python in Excel will feel like a natural part of how you work.
To finish, here are practical tips that help new users get real value from excel python quickly while avoiding the frustrations that trip up beginners. The first and most important habit is to keep each task scoped tightly. Decide before you write any code exactly what one input you are starting from and what one output you want. A clear goal turns a vague, intimidating project into a short, achievable sequence of steps you can complete in a single sitting.
Second, always test on a small sample before running on the full dataset. If you are processing fifty thousand rows, prove your logic on the first hundred so mistakes surface fast and cheap. Once the small version behaves correctly, scaling up is trivial. This mirrors the careful checking you already do in spreadsheets, where you verify a formula on one row before copying it across an entire column of important figures.
Third, comment your code in plain English. A single line explaining why a step exists will save your future self enormous confusion when you reopen the file months later. Good comments also help teammates who inherit your workbook, turning a private script into a shared asset. Treat readability as a feature, not an afterthought, because code that nobody can understand is code that nobody will trust or safely maintain.
Fourth, save your workbooks to OneDrive or SharePoint for the smoothest experience. Because computation happens in the cloud, cloud-stored files refresh and collaborate more reliably than ones buried on a local drive. Establishing this habit early prevents a class of confusing errors and ensures your automated reports run dependably whenever a colleague opens them, even if you are away or on a different device that day.
Fifth, build a personal library of reusable snippets. Every time you solve a cleaning or charting problem, copy the working code into a notes file with a short label. Over time this collection becomes your fastest learning resource, because most new tasks resemble something you have already done. Reusing proven code is not cheating; it is exactly how professional analysts work efficiently instead of reinventing the same solution repeatedly.
Sixth, keep practicing the fundamentals through quizzes and small challenges. Regular, low-stakes repetition cements syntax and concepts far better than occasional marathon study sessions. Set aside a short block each week to try something new, whether that is a fresh pandas method or a different chart type. Steady momentum beats intensity, and within a couple of months these small efforts add up to genuine, demonstrable competence.
Finally, be patient and celebrate small victories. Learning to code inside Excel is a meaningful skill upgrade, and every analyst who is fluent today started exactly where you are now. Each automated report and each cleaned dataset is real progress. Stay curious, keep your projects practical, and lean on the community when you need help, and excel python will soon feel like a dependable, everyday part of your analytical toolkit.
Excel Questions and Answers

Excel Functions List: The Complete Reference Guide to Every Formula You Need in 2026

Excel Finance Functions Guide With PMT, NPV, IRR and Loan Models

How to Convert Text to Excel: The Complete 2026 Guide to Importing TXT and CSV Files Into Spreadsheets

Excel Merge Tables: The Complete 2026 Guide to Combining Data Across Worksheets

Lock Formulas in Excel: The Complete 2026 Guide to Protecting Cells, Sheets, and Workbook Calculations
About the Author

Business Consultant & Professional Certification Advisor
Wharton School, University of PennsylvaniaKatherine Lee earned her MBA from the Wharton School at the University of Pennsylvania and holds CPA, PHR, and PMP certifications. With a background spanning corporate finance, human resources, and project management, she has coached professionals preparing for CPA, CMA, PHR/SPHR, PMP, and financial services licensing exams.