Day Trading (Candlestick Pattern) Test #1
What does this candle pattern's name mean?
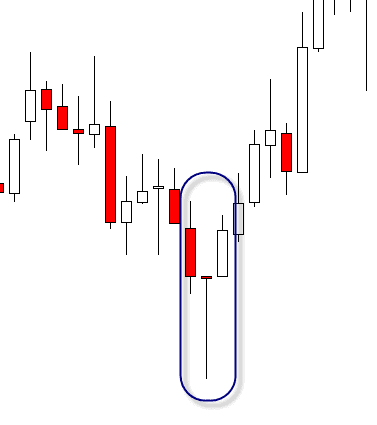
Explanation:
A candlestick design called a morning star has three candlesticks in it.
After a negative trend, a morning star forms, indicating the start of a price upward movement.
The candle shown is known as a____________.
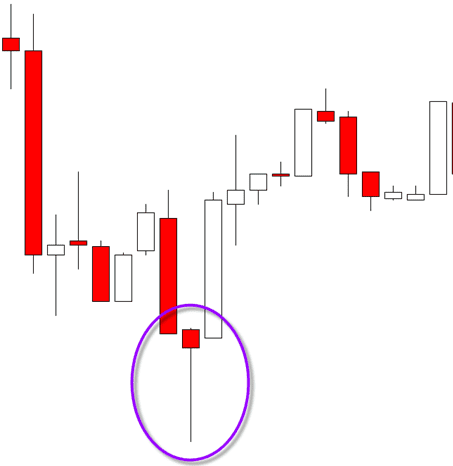
Explanation:
When an asset trades substantially below its initial price but rallies to close to the opening price throughout the trading period, it forms a price pattern known as a hammer in candlestick charting. This pattern creates a candlestick with the shape of a hammer, and the lower shadow is at least twice as large as the actual body.
What does this candle pattern's name mean?
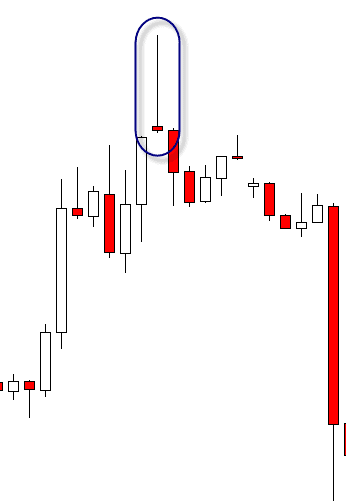
Explanation:
When a security opens, makes a substantial advance, and then finishes the day around the open once more, a shooting star is a sort of candlestick that results. A candlestick must form during a price gain for the formation to be regarded as a shooting star.
What do these candle types stand for in the marketplace.
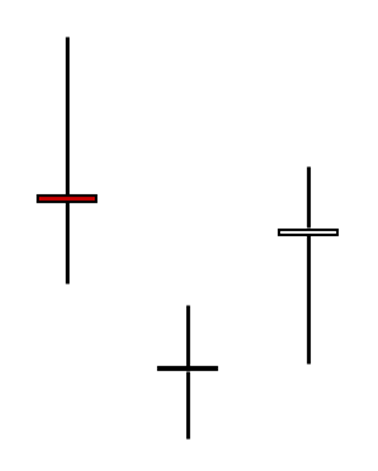
Explanation:
An indecision candlestick is one that lacks directional bias, as its name suggests. In other words, unlike a bullish or bearish pin bar, it doesn't suggest the market's likely future course. The majority of these forms develop during consolidation, however they can also develop at points of support and resistance.
Give the right names for the A, B, C, and D points on this candle.
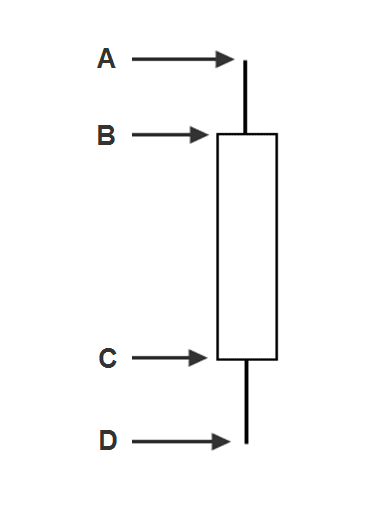
The correct answer:
A=HIGH B=CLOSE C=OPEN D=LOW
Pick the right candle's A, B, C, and D points.
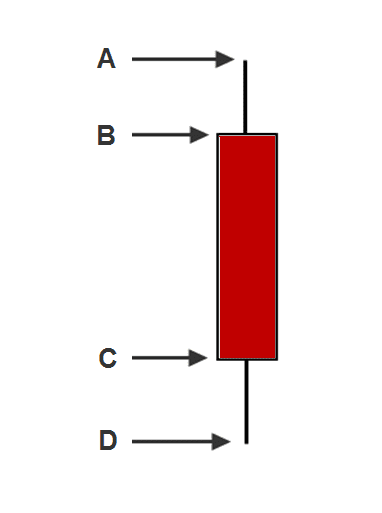
The correct answer:
A=HIGH B=OPEN C=CLOSE D=LOW
A ______________ candle pattern is the one seen below.
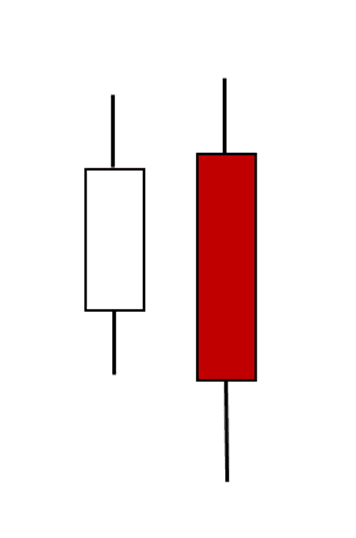
Explanation:
A technical chart pattern called a bearish engulfing pattern alerts traders to impending price declines. The pattern consists of a smaller up candle (white or green), which is eclipsed or "engulfed" by a larger down candlestick (black or red).
Advertisement
A ______________ is the name of the following candle design.
Explanation:
Technical analysts employ candlestick patterns called evening stars to forecast future price reversals to the downside. The evening star pattern is regarded by traders as a trustworthy technical indication despite its rarity. The pattern of the evening star is the reverse of that of the morning star.
When they occur at ________________, bearish reversal patterns are most likely to occur.
Explanation:
Resistance is something that prevents a price increase. The resistance level is the price on the chart where investors anticipate the greatest amount of selling to occur for the stock or index. The resistance level is always higher than the price of the market.
Please choose two bearish candle patterns.
Please select 2 correct answers
The correct answer:
Shooting Star
Evening Star
Mark each box that applies. Describe four different bullish candlestick patterns.
Please select 4 correct answers