Day Trading (Candlestick Pattern) Test #5
What is this two-day pattern of trend reversal?
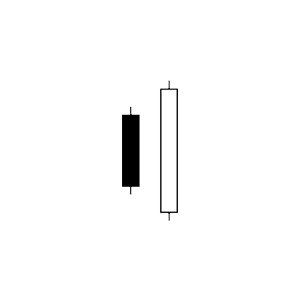
Explanation:
A little black candlestick is followed the next day by a massive white candlestick, the body of which totally engulfs or overlaps the body of the small black candlestick. This candlestick pattern is known as a bullish engulfing pattern.
What does this trend continuation pattern of two days mean?
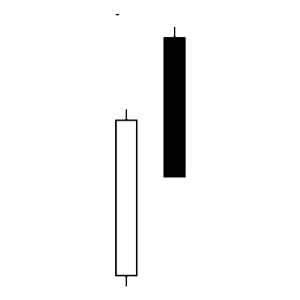
Explanation:
The second candle in a thrusting line closes at or below the first candle's midpoint. More bullish is a motif with piercings. The second candle opens below the first down candle's open but closes above the midpoint.
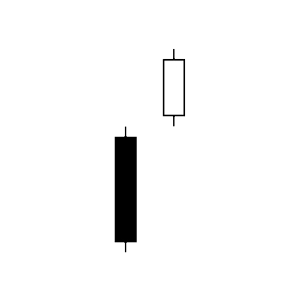
What is this two-day pattern of trend reversal?
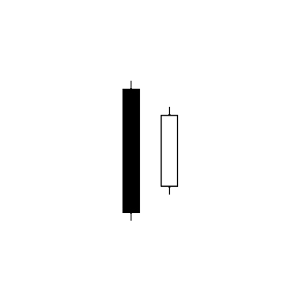
Explanation:
A candlestick chart indication called a bullish harami is used to identify bear trend reversals. It is typically signaled by a tiny price increase (shown by a white candle) that can be contained within the equity's recent downward price movement (represented by a black candle).
What exactly is this three-day pattern of trend reversal?
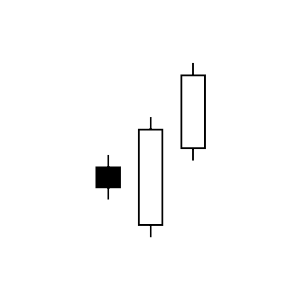
Explanation:
A bullish candlestick pattern with the following traits is the three outside up: The stock market is moving downward. Black candle number one. The second candle completely encloses the first candle and has a lengthy, white genuine body. White and having a higher close than the second candle, the third candle is lit.
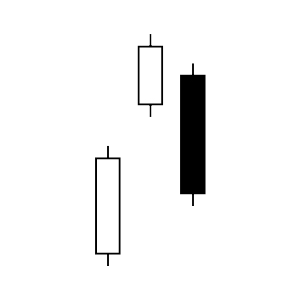
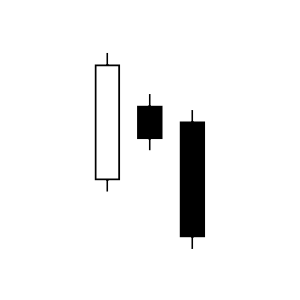
What does this trend continuation pattern of two days mean?
Explanation:
A red candle serves as the bullish separating line, and after that the price surges upward to produce a green candle that opens above the first candle. A green candle that represents the bearish separating lines is followed by a price spike that results in a red candle that opens below the green candle.
What does this three-day bullish trend continuation pattern?
Explanation:
There are three candles in Three Methods. Another long white candle in the trend's direction is placed after the previous long white candle. In order to bridge the gap between the first two days, the third day is a black candle.
What is this three-day bullish trend continuation pattern?
Explanation:
A three-bar candlestick formation known as the Upside Tasuki Gap denotes the continuance of the present uptrend. The third candle of the Upside Tasuki Gap partially fills the space between the first two bars. In addition to the Upside Tasuki gap, traders also use additional gap patterns to support bullish price action.
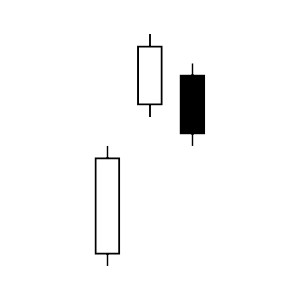
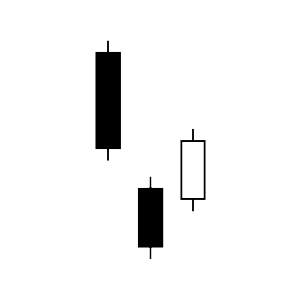
What does this three-day bearish trend reversal pattern?
Correct answer:
Bearish Outside Down
What does this three-day bearish trend reversal pattern?
Explanation:
A large up candle, a smaller down candle contained within the previous candle, and then another down candle that closes below the close of the second candle make up the three within down pattern, a bearish reversal pattern.
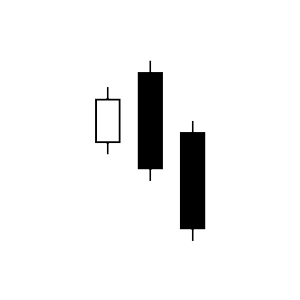
What does this three-day bearish trend continuation pattern?
Correct answer:
Bearish Downside Gap Filled
What does this three-day bearish trend continuation pattern?
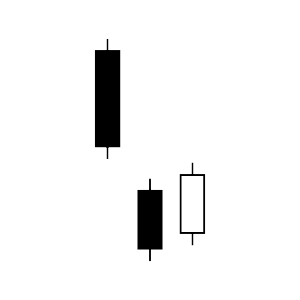
Explanation:
There are three candles at Tasuki Gap. Black candles with a space between them represent the first two days. The white candle on the third day fills in the space left by the first two candles. The trend is most likely to persist.