Day Trading (Candlestick Pattern) Test #6
Which of the following statements regarding a Tweezer Top is true?
Please select 2 correct answers
Correct answer:
The first candle is bullish followed by a bearish candlestick
and
It occurs during an uptrend
Which statement about a rising wedge pattern is correct?
Correct answer:
The aim for the trade is determined by calculating the distance projected downward from the breakpoint between the pattern's lowest dip and highest peak.
What kind of candle is this?
Explanation:
Dojis, which are frequently parts of patterns, are sessions in which the candlestick for security has an open and close that are almost equal. Doji is neutral patterns that can be found on their own and in many significant patterns.
The candlestick chart does not include the _____________?
Correct answer:
Volume of trading
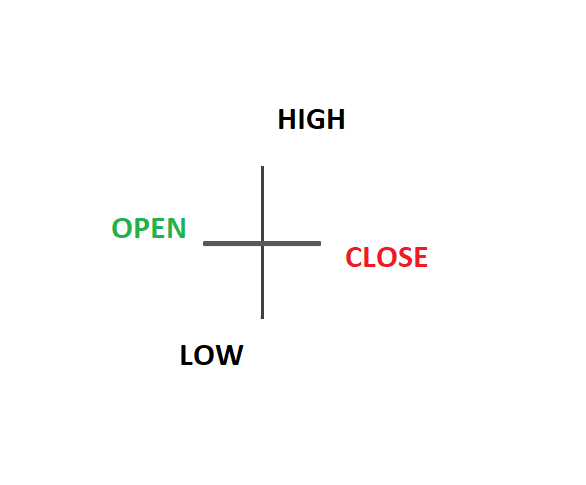
How does a candlestick chart show the daily high price?
Explanation:
A candle's shadow or wick, which may be visible on a candlestick chart, is a line that shows where a stock's price has changed in relation to its opening and closing values. These shadows essentially represent the highest and lowest prices at which a security has traded over a certain period of time.
Which types of charts offer an understanding of market psychology?
Explanation:
Traders use candlestick charts to comprehend price action since they are simple charts made up of individual candles. Candlestick price action entails identifying the price highs and lows for a given period, as well as where the price opened and closed for that period and close that are almost equal. Doji is neutral patterns that can be found on their own and in many significant patterns.
A rising wedge in a downward trend is recognized as a_______ pattern.
Explanation:
Following a brief pause and the confirmation of the breakout, continuation candlestick patterns, the foundation of one of the most widely used trading methods, indicates that the current trend is likely to continue. Reversal patterns are the antithesis of continuation structures.
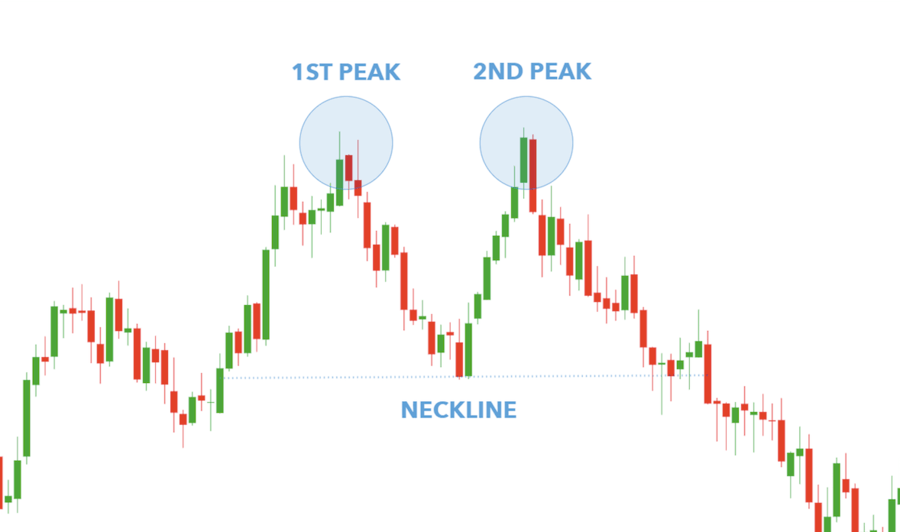
What is it? What does it indicate?
Please select 2 correct answers
Correct answer:
It signals the reversal and the beginning of a potential downtrend.
and
Double Top Pattern (looks like the letter "M")
What is it? What does it represent?
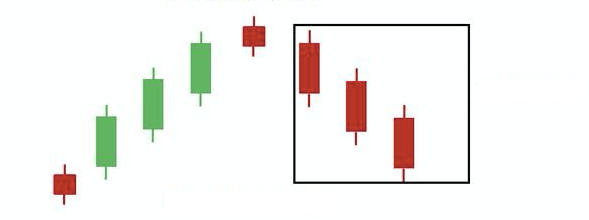
Explanation:
A bearish candlestick pattern called three black crows can signal the conclusion of an upswing. Along with other technical indicators like the relative strength index, traders use it (RSI).
How do you define "bearish"?
Explanation:
Investors that anticipate a decline in prices are known as bears or bearish investors. Investors might be bearish about the market as a whole, particular stocks, or particular sectors, much as a bullish investor.