Day Trading (Candlestick Pattern) Test #4
The ________ is not regarded as a component of the candlestick chart.
Explanation:
The daily volume of shares traded. Given that there are two sellers for every buyer, one can estimate the trading volume to be equal to 50% of the total number of shares traded.
Despite typically being viewed as a powerful signal, the ________ represents market indecision.
Explanation:
Since the initial price and the closing price are equal or nearly equal, a Doji candlestick pattern resembles a cross.
The term "double top" is:
The correct answer:
Reversal chart pattern when the price of a security increases to a certain level and then decreases from that level. It then increases again at that level before finally declining once again.
When there is market consolidation, this pattern emerges. As it matures, the prices get closer together and develop a triangular structure to disguise the move. The sentence refers to a ________ .
Explanation:
When security suffers a significant upward or downward movement, followed by a brief period of consolidation, and then resumes moving in the same direction, the result is a continuation chart pattern called a pennant pattern.
How does a candlestick chart depict the daily opening price?
The correct answer:
real body
The market exhibits the ___________ pattern when it produces higher highs and higher lows with a narrowing range.
Explanation:
A rising wedge is sometimes regarded as a bearish chart pattern that suggests a trend reversal following a bull run. A rising wedge is said to indicate a potential negative breakthrough. The pattern, like previous wedges, widens near the bottom and then contracts as the price rises and the trading range gets smaller.
According to technical experts, ________ represents a stock's price lower bound.
The correct answer:
Support
How does a candlestick chart show the daily high price?
Explanation:
In order to identify a trend and aid in trading decisions, trend lines are drawn at an angle. Trend lines are drawn above the price during a downturn and below the price during an uptrend. In an uptrend, two lows must be connected by a straight line to form a trend line.
The real body is found in which of the following?
Explanation:
A point-and-figure chart depicts price changes without taking time into account for stocks, bonds, commodities, or futures.
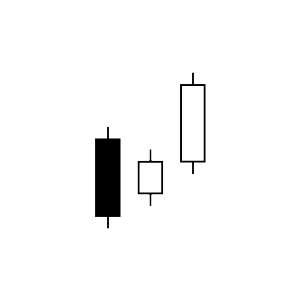
What does this three-day pattern of trend reversal look like?

Explanation:
A large down candle, a smaller up candle contained within the previous candle, and a third up candle that closes above the close of the second candle make up the three within up pattern, a bullish reversal pattern.
The Head and Shoulders pattern fits under which of the following categories?
Correct answer:
A Head and Shoulders pattern is made up of a single peak, a higher peak, a lower peak, and finally another peak. The pattern is confirmed by a last breach below the resistance level created by the two produced troughs.