FREE Workkeys Graphic Literacy Part 3 Questions and Answers
A patient requests a 10:00 appointment over the phone. Which day is available to take a 10:00 appointment according to the attached schedule?

Explanation:
According to the schedule, the only open 10:00 appointment is on Tuesday. On Monday, Ms. Phillips has reserved
the 10:00 time, on Wednesday the office is closed, and on Thursday there is an office meeting scheduled during the
10:00 time slot.
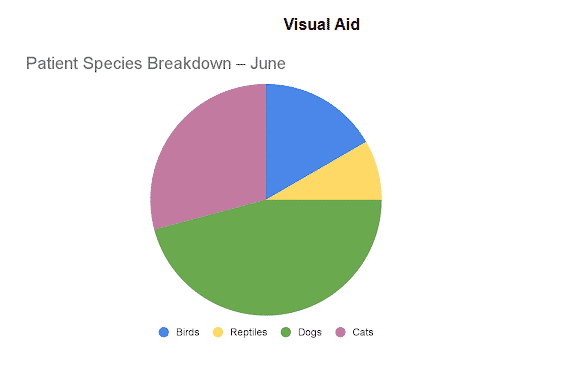
Which species made up the smallest percentage of patients treated at Dr. Bark's veterinary clinic in June, according to the attached patient records?
Explanation:
In a pie chart, the size of the “slices” indicates the overall percentage represented in that category. In this chart,
the smallest slice is yellow, which represents reptiles. The next largest is birds (blue), then cats (purple), and dogs
(green) appear to make up the largest percentage of this vet’s patients.
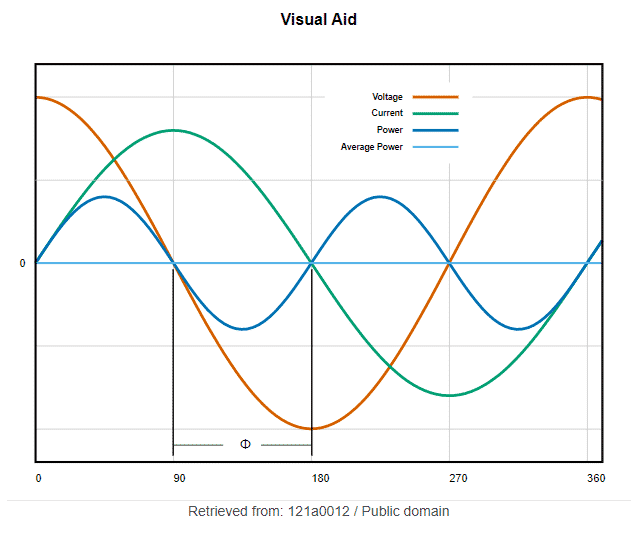
In the attached, what type of graph is shown?
Explanation:
The graph provided is a line graph that displays multiple pieces of data in the form of lines.
On the attached graph, which color line represents voltage?

Explanation: According to the legend on the graph, the orange line represents voltage.
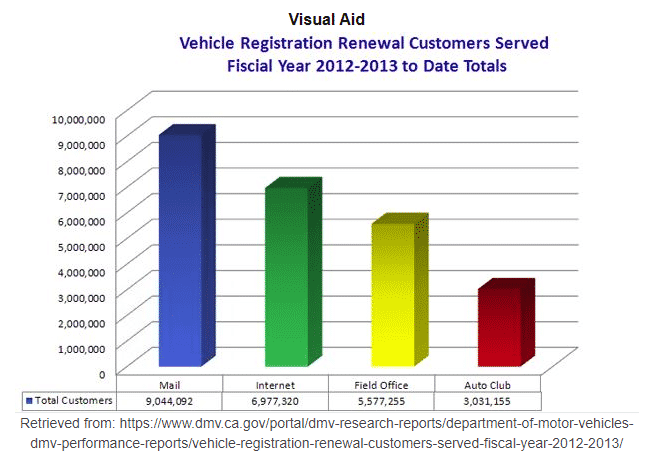
What was the most common method for drivers to renew their vehicle registration in 2012-2013, according to the attached chart?
Explanation:
The largest column on the chart is that of mail-in registration. Second was over the internet, then at a field office,
and the fewest drivers opted to renew via the auto club.
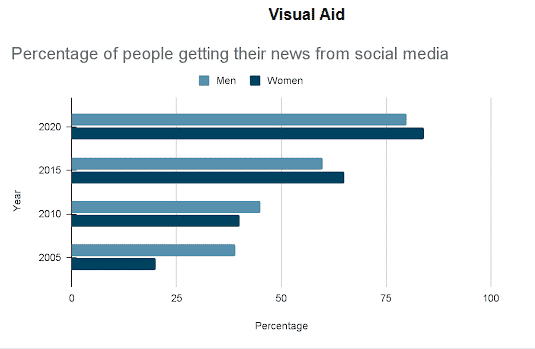
In which year was it first reported that the percentage of women obtaining their news from social media was higher than the percentage of men getting their news from social media, according to the attached graph?
Explanation:
The legend at the top notes that men are represented by the light blue and women by the darker blue. The first time
the dark blue line extends farther than the light blue line, indicating a greater percentage, is in 2015.
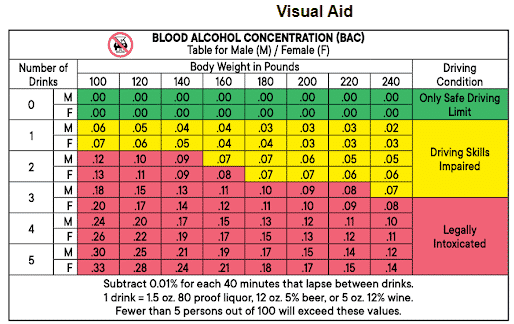
What is the least amount of beverages a 200-pound male can have before his driving abilities are considered impaired, according to the attached chart?
Explanation:
The yellow section indicates the section where driving skills are considered impaired. Finding the “200” on the
chart and following it down, one drink could land someone in the yellow impaired zone.
Advertisement
What would a 140-pound woman's blood alcohol level concentration be if she had five drinks? (For more information, see the chart attached.)

Explanation:
According to the chart, her BAC would measure as 0.24 after five drinks. The other answer options are for
different weights and/or a different number of drinks.
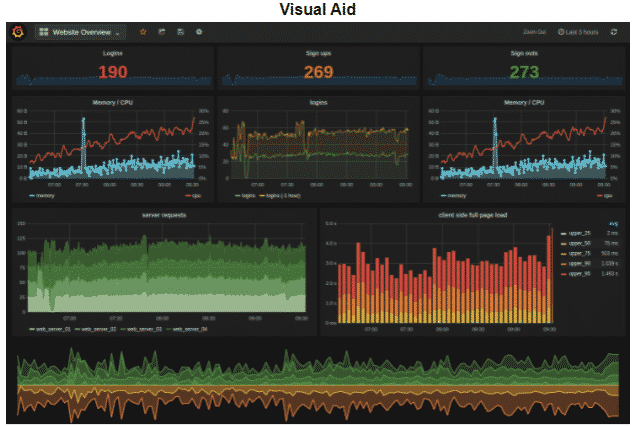
How many logins were made based on the information on the attached dashboard?
Explanation:
The logins are tracked and labeled in the upper left part of the screen.
What time period is represented by the data on the linked dashboard?

Explanation:
The time frame for the data is provided at the top right of the screen.
What information is provided by the dashboard that is attached?

Explanation:
The top left side of this dashboard provides the user with information about what data is being displayed. In this
case, all the graphs are showing pieces of data about the usage of a website, such as logins and server requests.
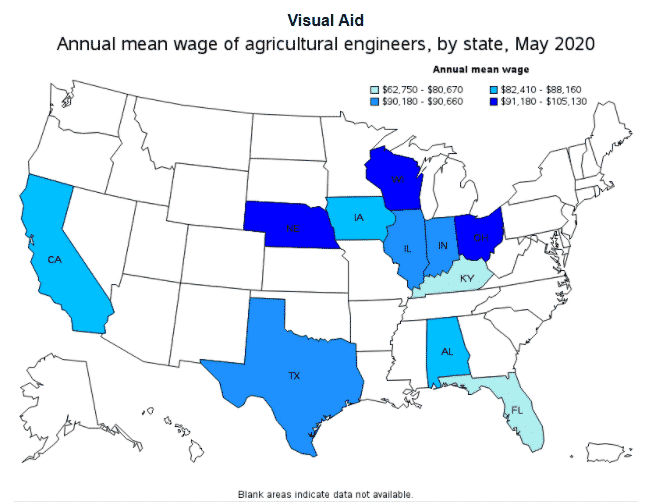
Which state has a mean wage for agricultural engineers of more than $91,000 per year, according to the attached graph?
Explanation:
The dark blue states are those that have a mean wage of over $91,000 a year. The only dark blue state listed as
an answer option is Ohio (OH). The others pay less than an average of $91,000 per year.
An agricultural engineer in Kentucky (KY) may expect to earn which of the following salaries? (Refer to the diagram attached.)

Explanation:
Kentucky is represented by the light blue color. According to the legend, the range for mean wages in Kentucky
is $62,750-$80,670, and $73,100 falls within that range. The other ranges are all higher and would only be found
in other states.
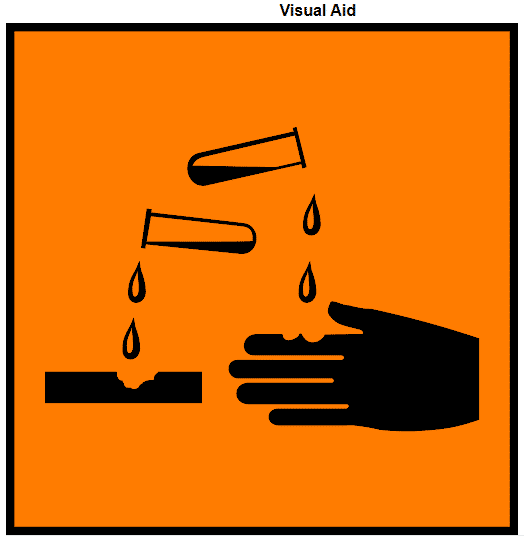
What is the most likely message conveyed by the images on the hazard sign?
Explanation:
The image shows liquids coming out of test tubes, likely chemicals, falling onto a brick-looking image and a hand,
both of which have some damage indicated. The inference is that these chemicals are corrosive and will eat away
at flesh and objects that are unprotected. While they are liquid dangers, the use of test tubes in the warning suggest
chemical compounds as might be found in labs. There is no indication of it being a warning of toxic or flammable hazards.
Advertisement
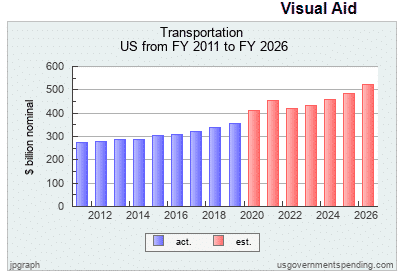
Transportation expenditures are expected to be over $453 billion in 2025, according to the attached graph. What year do you think they'll be even higher?
Explanation:
The bar graph for 2025 indicates an estimated cost projection of $453 billion. Of the answer options provided, the
next bar that indicates a higher number than that is 2025 when costs are projected to be over $483 billion. While
2026 is also projected to be more, there is an earlier option. 2020 comes before 2025, so that is not the correct
answer, and 2025 is projected to be less than the costs in 2025.
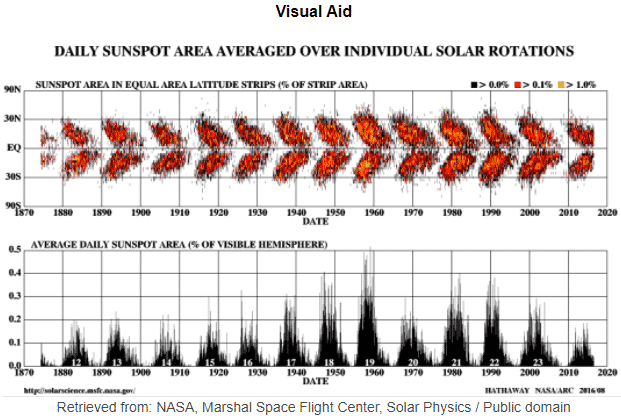
Which of the following trends may be seen in the attached graph?
Explanation:
As exemplified in the graph, sunspot area increased until about the 1960s, at which point it began to
gradually decrease again.
According to the graphs attached, where are the sunspots most concentrated?

Explanation:
As seen on the attached graph, the sunspot areas mostly impact low latitudes, close to the equator and
between 30 degrees north and 30 degrees south.
What happens to the top graph's percentages as the percentages on the bottom graph in the attachment rise?

Explanation:
As the percentages (black bars) on the bottom graph increase, the colors on the top graph expand and change color,
indicating a higher percentage of strip area and a wider geographic range of impact.
Which of these groups' population growth hasn't slowed in the last 500 years, according to the attached graph?

Explanation:
China, Latin America, and India all show population dips at some point over the last 500 years. Western Europe
does not show a dip, although there was a period of stagnation in the early 1900s.
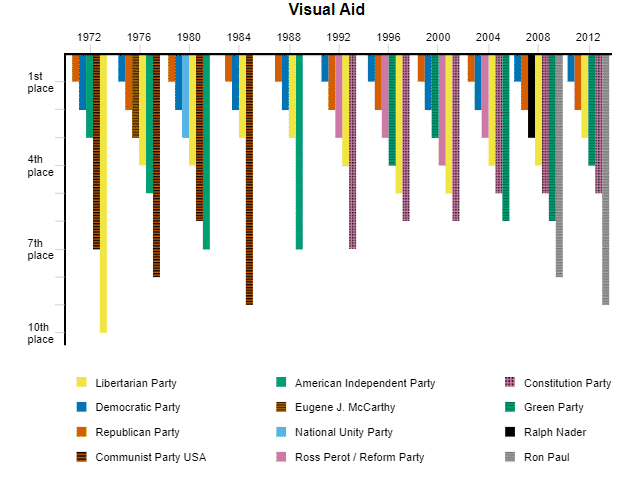
Which political party is most likely to win a presidential election based on the statistics in the attached graph?
Explanation:
According to the graph, the Republican Party has won six of the eleven elections shown, while the
Democratic Party has won five.
Which political party's popularity fell from 2000 to 2008, according to the attached graph?

Explanation:
Between these years, the Green Party went from third place in elections to sixth place.
Advertisement
Which of these statements most accurately summarizes the data on the graph attached?

Explanation:
This statement best sums up the data on the graph because these two parties have won every
election represented on the graph.
Which piece of information does the attached graph not provide?

Explanation:
The number of votes received by each party is not displayed on the graph. All other answer choices
can be found in the graph.
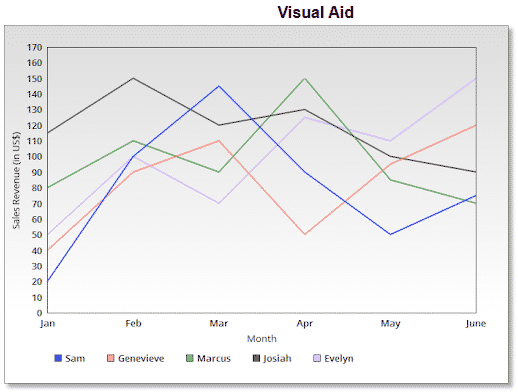
Which salesperson had the lowest-selling month in the first half of the year, according to the attached graph?
Explanation:
The lowest point on the graph, indicating the smallest amount of sales revenue, belongs to Sam in January.
The others all have higher points on the graph throughout the 6 month span.
Which month did everyone's sales grow over the prior month? (For a visual representation, see the attachment.)

Explanation:
February is the only month on the graph where every person’s performance line goes up. The other months
all have at least one salesperson show a decline in sales.