FREE Analyzing Data with Microsoft Power BI Questions and Answers
You have a custom connector that gives you the following information for each email sent in the last year: ID, From, To, Subject, Body, and Has Attachments. There are returned more than 10 million records. Based on whom employees send emails to, you create a report that analyzes the internal networks of those employees. You must keep the recipients of the report from viewing the examined emails. The model size must be reduced in the solution. What ought you to do?
Explanation:
""Implement row-level security (RLS) so that the report recipients can only see results based on the emails they sent"" and ""From Model view, set
the Subject and Body columns to Hidden"" does not reduce the size of the model.
You You have a report with a column chart and a bar chart in it. By client segment, the customer count is displayed as a bar graph. Sales are displayed in a column chart by month. The percentage of the month's total sales that belong to the customer segment must be visible when a segment is selected in the bar chart. When the bar chart is used, how should the visual interactions be configured on the column chart? a map of 500,000 clients using a R visual. In the fields supplied to the visual, you include the CustomerID, Latitude, and Longitude values. Every client ID is distinct. When consumers load the visual on powerbi.com, they only see a portion of the customers. What is the problem's root cause?
Explanation:
All but the data you wish to focus on is removed through filters. Filtering is not highlighted. It emphasizes a portion of the visible data rather than removing any of it; the remaining visible data is muted rather than removed.
You have a sales transaction database stored in Azure SQL. The database is regularly updated. To find phony transactions, you must create reports from the data. After an update, the data must be accessible within five minutes. How should the data connection be set up?
Explanation:
When you connect to your data source using Power BI Desktop, you can always import a copy of the data into the program. An alternative method,
utilizing DirectQuery to connect directly to the data source, is available for some data sources.
DirectQuery: Power BI Desktop does not import or copy any data. The chosen tables and columns for relational sources show up in the Fields list.
The dimensions and measurements of the chosen cube are displayed in the Fields list for multi-dimensional sources like SAP Business Warehouse.
Power BI Desktop runs queries on the underlying data source while you work with or construct a visualization, ensuring that you're constantly viewing
up-to-date information.
You have a data model with a large number of intricate DAX expressions. The RELATED and RELATEDTABLE functions are frequently mentioned in the expressions. You must offer a suggestion for how to use the RELATED and RELATEDTABLE functions less frequently. What ought to you suggest?
Explanation:
Connecting to two or more data sources, modifying them as necessary, and then combining them into a usable query constitutes combining data.
You merge the queries when you have one or more columns you want to add to another one.
The RELATEDTABLE function, which has no logical expression, is a shortcut for the CALCULATETABLE function, it should be noted.
A table of values is returned by CALCULATETABLE after it evaluates a table expression in a modified filter context.
You have a list of potential clients with 1,500 rows of data. The following fields are included in the list: - First name - Last name - Email address - State/Region - Phone number The list is imported into Power Query Editor. The list must contain data for every State or Region that you intend to target with a marketing campaign. What are the two things you should do? Each right response offers a piece of the answer. NOTE: There are two correct answers
Please select 2 correct answers
Explanation:
Features for Data Profiling, Quality, and Distribution in Power BI and Power Query
Go to the View tab, select the Data Preview Group, and then check the following boxes to enable these features:
- Column quality
- Column profile
- Column distribution
- Column profile
Turn on the Column Profiling feature.
- Column distribution
Can use it to visually realize that your query is missing some data because of distinct and uniqueness counts.
You are working with a sizable dataset that has more than a million rows. The table contains a Date datetime field. Without sacrificing data access, the data model needs to be shrunk. What ought you to do?
Explanation:
We must separate the time and date tables. Additionally, since the time is repeated every day, we do not need to include it in the date table. To connect the date to the date table and the time to the time table, separate the DateTime column into distinct date and time columns in your fact table. In order for each time in your data to correlate to a row in your time table, the time must be adjusted to the nearest round minute or second.
You have one of the three Azure SQL databases listed below: - Test - Production - Development You have a dataset that draws its data from the development database. You must set up the dataset so that you can quickly switch between the powerbi.com development, test, and production database servers as the data source. Which one is the best?
Explanation:
The degree to which one data source must be isolated from other data sources can be defined using privacy level settings.
An organizational data source restricts a data source's visibility to a select group of reliable individuals. While being hidden from all Public data
sources, an Organizational data source is accessible to other Organizational data sources.
You create a report to aid the sales staff in comprehending their performance and the factors that influence sales. The team requires a single visualization to determine the variables that influence success. Which kind of visualization ought you to employ?
Explanation:
The major influencers visual aids in your understanding of the variables that affect a metric of interest. It analyzes your data, ranks the important variables, and lists them as the main deciding factors.
You should use the key influencers visual if you wish to:
✑ View the influences on the metric under study.
✑ Compare and contrast the relative weights of these variables. Do short-term contracts, as opposed to long-term ones, have a greater effect on churn?
You have a CSV file with user complaints in it. The file has a column called Logged in it. Each complaint's log entry includes the date and time that it happened. The information in Logged is formatted as follows: 2018-12-31 08:59. You must be able to use an internal date hierarchy and the logged date to assess the complaints. What ought you to do?
Explanation:
You must change the new column's data type to Date in order to use the built-in date hierarchy.
You are setting up a Microsoft Power BI data model to let users use Q&A to ask inquiries in natural language. The following metric is present in the Customer database that you have. Count of customers = DISTINCTCOUNT (Customer[CustomerID]) Customers are frequently referred to as subscribers by users. By employing Q&A, you must make sure that users may obtain a useful result for "subscription count." The model's size must be kept to a minimum in the solution. What should you do?
Explanation:
Synonyms can be added to columns and tables.
Note: This action only applies to Q&A (and not to Power BI reports in general). Users frequently use a number of words, such as total sales, net sales, and total net sales, to refer to the same thing. These synonyms can be added to Power BI model tables and columns.
This action only applies to Q&A (and not to Power BI reports in general). Users frequently use a number of words, such as total sales, net sales, and total net sales, to refer to the same thing. These synonyms can be added to Power BI model tables and columns.
In a star schema with four tables named Sales, Customer, Date, and Product, you have sales data. Purchase and shipping dates are listed in the Sales table. Although you will most frequently utilize the purchase date, you may also examine the data using both dates separately and jointly. To support the analysis, you must create an imported dataset. The model size and number of queries against the data source must be kept to a minimum. What data modeling approach should you employ?
Explanation:
There can only be one active relationship.
NOTE: When the data is loaded, Power BI Desktop makes an effort to locate and develop relationships for you if you query two or more tables at once. Cardinality, Cross filter direction, and Make this connection active are relationship options that are pre-set by default.
You launch Power Query Editor and open a query. The percentage of empty values in each column must be rapidly determined. Which Data Preview selection is best?
Explanation:
Column quality: In this area, we can quickly check the percentages of valid, incorrect, and empty data values related to the selected table.
Note: The following data profiling functions are visible in Power Query Editor's Data Preview Section's View tab:
- Column quality
- Column distribution
- Column profile
You have a list of potential clients with 1,500 rows of data. The following fields are included in the list: ✑ First name ✑ Last name ✑ Email address ✑ State/Region ✑ Phone number The list is imported into Power Query Editor. The list must contain data for every State or Region that you intend to target with a marketing campaign. What are the two things you should do? Each right response offers a piece of the answer. NOTE: A point is awarded for each choice that is correct.
Please select 2 correct answers
Explanation:
Data distribution, quality, and profiling are characteristics of Power BI and Power Query.
Go to the View tab, select the Data Preview Group, and then check the following boxes to enable these features:
✑ Column quality
✑ Column profile
✑ Column distribution
Four sales regions are available. There are several sales managers in each region. In a data model, you apply row-level security (RLS). You give each role access to the necessary distribution lists. You have sales reports that allow for regional analysis. The sales managers have access to their region's sales data. Records from other regions are hidden from the sales managers' view. A sales manager relocates to a new area. You must make sure the sales manager can get the accurate sales information. What should you do?
Explanation:
You no longer need to keep a long list of users when you use AD Security Groups. You only need to add the AD Security group with the necessary permissions; Power BI will take care of the rest! This denotes a compact and straightforward security file with permissions and an AD Security group.
Note: You must map members to dataset roles once you've published your data to Power BI.
Users or security groups can be members. We advise mapping security groups to dataset responsibilities whenever possible. It requires controlling Azure Active Directory security group memberships. It might assign your network administrators to complete the operation.
You use the Microsoft Power BI Service to generate a dashboard. A card visual on the dashboard displays the overall sales for the current year. Using the Viewer role on the workspace, you may provide users access to the dashboard. The user requests daily alerts for the number displayed on the card visual. Notifications must be automated. What should you do?
Explanation:
The dashboards, paginated reports, and report pages that are most important to you can be subscribed to by you, your coworkers, and yourself. You can subscribe to Power BI emails to:
✑ Choose whether you want to receive emails every day, every week, every hour, every month, or just once per day after the initial data refresh.
✑ Select how frequently you want to receive emails: daily, weekly, hourly, or monthly.
A database containing the tables displayed in the following table is used to produce a report for analyzing client transactions. You import the tables. Which relationship should you use to connect the tables?
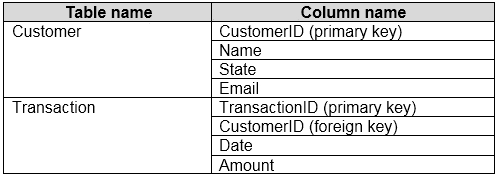
Explanation:
A client may engage in numerous transactions. There is exactly one customer each transaction.