FREE ACT Science Question and Answers
Researchers looked at a species of termite's foraging environments across the country. The degree of internal disintegration caused by termites chewing the bark on a tree served as a proxy for the termite population in that tree. The investigation also measured how well-tolerated shade was by each type of tree. Shade tolerance for the tree species used in this experiment could be divided into two categories: shade tolerant (ST) and intermediate shade (IS). Finally, they noted the typical monthly rainfall for the site where the species was being monitored. The data are summarized in the graph below. According to scientists' hypotheses, tree species with higher average rainfall would exhibit the highest levels of breakdown. Additionally, they proposed that the trees' increased shade would encourage more termites, which would lead to increased decomposition.
The amount of termites in a particular tree species and the amount of rainfall on average are related in that .

The highest levels of decomposition are found in the tree species with the highest average rainfall (Morus rubra, Juniperus scopulorum, and Tsuga canadensis) (3.21, 4.03, and 2.38.) Keep in mind that the experiment approximates the termite population using the degree of disintegration.
Researchers looked at a species of termite's foraging environments across the country. The degree of internal disintegration caused by termites chewing the bark on a tree served as a proxy for the termite population in that tree. The investigation also measured how well-tolerated shade was by each type of tree. Shade tolerance for the tree species used in this experiment could be divided into two categories: shade tolerant (ST) and intermediate shade (IS). Finally, they noted the typical monthly rainfall for the site where the species was being monitored. The data are summarized in the graph below. According to scientists' hypotheses, tree species with higher average rainfall would exhibit the highest levels of breakdown. Additionally, they proposed that the trees' increased shade would encourage more termites, which would lead to increased decomposition.
What connection exists between the degree of decomposition and shade tolerance?

The chart shows that the levels of decomposition for species with a shade tolerance (ST) are higher than those for species with an intermediate shade tolerance (IS).
To determine whether calcium can have an impact on gene regulation, scientists undertake an experiment. High calcium concentrations are thought to interact with the proteins Cs3 and Gfy, increasing the transcription of the genes F4597 and BC392. The experiment's methodology is outlined below.
Identify the genes BC392 and F4597.
Create a vector with the two genes within yeast cells.
growing yeast cells
Grow yeast cells in two different growth media: plate A, which is deficient in calcium, and medium B, which has calcium supplements (plate B)
What data outcomes from the experiment would be consistent with the theory?
The data would need to demonstrate that calcium boosted the gene activity in order to validate the theory. Plate B contains a growth medium with added calcium, therefore greater gene activity in those plates would confirm the theory.
Nitra-Grow is a chemical additive that may be added to plants to aid in growth, and a team of scientists wanted to investigate its effects. Three different plant test groups received the same amount of water, type of soil, and amount of sunlight. No further chemicals were applied to Plant A. 5g of Nitra-Grow was given to Plant B. To investigate if Nitra-Grow performed any better than a straightforward household product based on nitrogen, Plant C was fed 5g of ammonia. After that, the plants are measured five days in a row to determine their average height (in cm). Imagine if the experiment was carried out once more with Plant D. 15g of Nitro-Grow and 15g of ammonia were supplied to Plant D. What outcomes might be anticipated?

There is not enough data available. Given that Ammonia's adverse consequences were ultimately established, you cannot presume it will function at its best. The combined effects of the two substances have not been studied.
Nitra-Grow is a chemical additive that may be added to plants to aid in growth, and a team of scientists wanted to investigate its effects. Three different plant test groups received the same amount of water, type of soil, and amount of sunlight. No further chemicals were applied to Plant A. 5g of Nitra-Grow was given to Plant B. To investigate if Nitra-Grow performed any better than a straightforward household product based on nitrogen, Plant C was fed 5g of ammonia. After that, the plants are measured five days in a row to determine their average height (in cm).
What connection exists between plant height and the number of days?

The heights of all plants rise as time passes (except for plant B on day 6). Just because the plants grow doesn't mean that the day changes.
Nitra-Grow is a chemical additive that may be added to plants to aid in growth, and a team of scientists wanted to investigate its effects. Three different plant test groups received the same amount of water, type of soil, and amount of sunlight. No further chemicals were applied to Plant A. 5g of Nitra-Grow was given to Plant B. To investigate if Nitra-Grow performed any better than a straightforward household product based on nitrogen, Plant C was fed 5g of ammonia. After that, the plants are measured five days in a row to determine their average height (in cm).
Which variable is the dependent one?

The plant's height is the correct answer. What kind of chemical was added to the plant DEPENDS on the height of the plant. Because the scientist had control over which chemical went into each plant, the type of chemical added was the independent variable.
To determine whether calcium can have an impact on gene regulation, scientists undertake an experiment. High calcium concentrations are thought to interact with the proteins Cs3 and Gfy, increasing the transcription of the genes F4597 and BC392. The experiment's methodology is outlined below.
Identify the genes BC392 and F4597.
Create a vector with the two genes within yeast cells.
growing yeast cells
Grow yeast cells in two different growth media: plate A, which is deficient in calcium, and medium B, which has calcium supplements (plate B)
What could be altered to make the experiment's design stronger?
By using a reference plate, the researchers could verify that the vectors were applied appropriately and that the yeast cells were healthy and capable of expanding despite variations in calcium concentration.
Advertisement
A phenomena known as "Global Warming" has resulted from a gradual rise in the earth's air temperature from the early 1900s. Despite extensive documentation of the steady temperature increase, the origin of global warming is still up for debate.
Scientist 1
Scientist 1 thinks that the rise in temperature over the last century is due to "external forcings." Temperature changes over a long period of time can be influenced by "external forcings." The alteration in the earth's orbit around the sun is an illustration of an external influence. A 26,000-year cycle of the earth's orbit affects global warming and cooling tendencies.
Scientist 2
Scientist 2 is of the opinion that the rise in greenhouse gases like carbon dioxide and methane is a result of human activity. Although greenhouse gases naturally contribute to global warming, their concentration in the atmosphere has the potential to amplify this effect. While atmospheric methane levels have increased by 148% since 1750, carbon dioxide concentrations have increased by 36% during that time.
Compare and contrast the various scientific theories.
Both scientists agree that there has been global warming over the past century, but one thinks it is a result of variations in the earth's orbit while the other thinks that man is to blame for the rise in temperatures.
A phenomena known as "Global Warming" has resulted from a gradual rise in the earth's air temperature from the early 1900s. Despite extensive documentation of the steady temperature increase, the origin of global warming is still up for debate.
Scientist 1
Scientist 1 thinks that the rise in temperature over the last century is due to "external forcings." Temperature changes over a long period of time can be influenced by "external forcings." The alteration in the earth's orbit around the sun is an illustration of an external influence. A 26,000-year cycle of the earth's orbit affects global warming and cooling tendencies.
Scientist 2
Scientist 2 is of the opinion that the rise in greenhouse gases like carbon dioxide and methane is a result of human activity. Although greenhouse gases naturally contribute to global warming, their concentration in the atmosphere has the potential to amplify this effect. While atmospheric methane levels have increased by 148% since 1750, carbon dioxide concentrations have increased by 36% during that time.
What evidence would back up Scientist 1's hypothesis?
It will be essential to compare the average temperature change over an extremely long period of time because the orbital variance changes so slowly (over thousands of years). Although an orbital variances diagram could be intriguing, it doesn't provide any useful information for understanding climate change.
A phenomena known as "Global Warming" has resulted from a gradual rise in the earth's air temperature from the early 1900s. Despite extensive documentation of the steady temperature increase, the origin of global warming is still up for debate.
Scientist 1
Scientist 1 thinks that the rise in temperature over the last century is due to "external forcings." Temperature changes over a long period of time can be influenced by "external forcings." The alteration in the earth's orbit around the sun is an illustration of an external influence. A 26,000-year cycle of the earth's orbit affects global warming and cooling tendencies.
Scientist 2
Scientist 2 is of the opinion that the rise in greenhouse gases like carbon dioxide and methane is a result of human activity. Although greenhouse gases naturally contribute to global warming, their concentration in the atmosphere has the potential to amplify this effect. While atmospheric methane levels have increased by 148% since 1750, carbon dioxide concentrations have increased by 36% during that time.
Assume that Scientists 1 and 2 were both accurate. What would happen to the temperature over the following 20,000 years?
Both scientists are likely correct if the temperature is still rising but is increasing at a rate that is connected with variations in the earth's orbit. Temperature fluctuations show that Scientist 1 is correct whereas a steady rise in temperature points to Scientist 2 being right.
A phenomena known as "Global Warming" has resulted from a gradual rise in the earth's air temperature from the early 1900s. Despite extensive documentation of the steady temperature increase, the origin of global warming is still up for debate.
Scientist 1
Scientist 1 thinks that the rise in temperature over the last century is due to "external forcings." Temperature changes over a long period of time can be influenced by "external forcings." The alteration in the earth's orbit around the sun is an illustration of an external influence. A 26,000-year cycle of the earth's orbit affects global warming and cooling tendencies.
Scientist 2
Scientist 2 is of the opinion that the rise in greenhouse gases like carbon dioxide and methane is a result of human activity. Although greenhouse gases naturally contribute to global warming, their concentration in the atmosphere has the potential to amplify this effect. While atmospheric methane levels have increased by 148% since 1750, carbon dioxide concentrations have increased by 36% during that time.
What could have led to a rise in greenhouse gases since 1750?
Burning coal for energy during the Industrial Revolution in the early 1900s led to a rise in greenhouse gas emissions. Additionally, the population growth has accelerated deforestation, which has decreased the amount of plants and trees that absorb carbon dioxide. There isn't much evidence connecting ozone layer loss to climate change as of now.
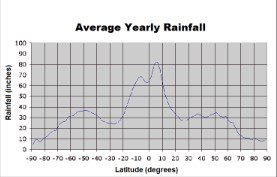
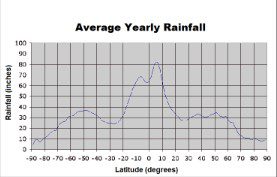
The average amount of rain received worldwide is shown in the graph below. Equator is located at latitude 0 degrees. Latitudes that are positive are north of the equator and those that are negative are south of the equator. An Earth pole corresponds to a latitude with a magnitude of 90 degrees.
Which best sums up the pattern of rainfall between 30 and 60 degrees latitude?

Even though there is some variance, the rainfall averages around 30 inches when we look at the graph's curve between 20 and 60 degrees. Therefore, we may say that the rainfall at these latitudes is roughly same.
The average amount of rain received worldwide is shown in the graph below. Equator is located at latitude 0 degrees. Latitudes that are positive are north of the equator and those that are negative are south of the equator. An Earth pole corresponds to a latitude with a magnitude of 90 degrees.
Which of the following statements best reflects the graph's rainfall trend?

Near the equator, rainfall peaks (zero degrees). The poles (90 and 90 degrees) have the lowest points.
The average amount of rain received worldwide is shown in the graph below. Equator is located at latitude 0 degrees. Latitudes that are positive are north of the equator and those that are negative are south of the equator. An Earth pole corresponds to a latitude with a magnitude of 90 degrees.
Where does the average annual rainfall of 35 inches occur?

Find 35 inches on the Rainfall y-axis. Find each related x-coordinate and the point on the graph where this y-coordinate touches the curve. There are three: degrees 55, 20, and 20. It is not an option, even though 50 degrees also equates to nearly 35 inches of rain.
Advertisement
The average amount of rain received worldwide is shown in the graph below. Equator is located at latitude 0 degrees. Latitudes that are positive are north of the equator and those that are negative are south of the equator. An Earth pole corresponds to a latitude with a magnitude of 90 degrees.
The Capricorn Tropic is located around 23.5 degrees south of the equator. How much more precipitation does this latitude receive than the North Pole on average?

Locate 23.5 degrees on the x-axis and the appropriate amount of rainfall on the y-axis to get the difference in rainfall between these two latitudes (25 inches). Find the North Pole's latitude (90 degrees) and the equivalent amount of rainfall next (10 inches). Lastly, divide the result by two to determine how much more rain falls at the Tropic of Capricorn: 25−10=15 in
A phenomena known as "Global Warming" has resulted from a gradual rise in the earth's air temperature from the early 1900s. Despite extensive documentation of the steady temperature increase, the origin of global warming is still up for debate.
Scientist 1
Scientist 1 thinks that the rise in temperature over the last century is due to "external forcings." Temperature changes over a long period of time can be influenced by "external forcings." The alteration in the earth's orbit around the sun is an illustration of an external influence. A 26,000-year cycle of the earth's orbit affects global warming and cooling tendencies.
Scientist 2
Scientist 2 is of the opinion that the rise in greenhouse gases like carbon dioxide and methane is a result of human activity. Although greenhouse gases naturally contribute to global warming, their concentration in the atmosphere has the potential to amplify this effect. While atmospheric methane levels have increased by 148% since 1750, carbon dioxide concentrations have increased by 36% during that time.
What evidence backs up Scientist 2's hypothesis?
Given that rising temperatures are linked to rising levels of greenhouse gases, a graph showing a positive correlation between the two is suggestive of a link between rising greenhouse gas output and global warming.
The tumor size increase over time for each of the three potential treatment options is measured in the table above. Each tumor was first measured at a 2 inch size. Each tumor was measured once a month for a total of five measurements.
Based on the information presented above, what conclusion CANNOT be drawn?
The data does not provide enough information to determine if the growth of the cancer cells in any of the three groups was uniform. Depending on their size, stage, and other variables, cancer cells can develop at various rates.
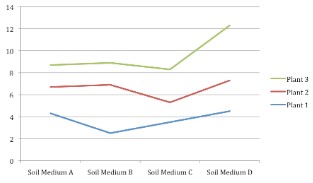
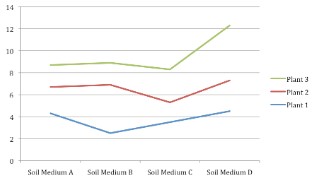
Three different plant species' height increase after two weeks is depicted in the graph above. Every plant species was raised in 4 distinct types of soil. The identical environment, containing the same amounts of light, water, and oxygen, was used to develop every plant.
What could be changed about this experiment to enhance the way the data is displayed?

The data representation would be improved by each of the given possibilities.
Three different plant species' height increase after two weeks is depicted in the graph above. Every plant species was raised in 4 distinct types of soil. The identical environment, containing the same amounts of light, water, and oxygen, was used to develop every plant.
What aspect of this experiment's design would be weak?

The control setting for the experiment would be less effective if one plant species had a different preference for light because the experiment's design keeps light consistent for all three plant species.
Three different plant species' height increase after two weeks is depicted in the graph above. Every plant species was raised in 4 distinct types of soil. The identical environment, containing the same amounts of light, water, and oxygen, was used to develop every plant.
What impact does soil Medium C have on plant growth according to the chart?

The only plant with enhanced height growth in Medium C was Plant 1. When in Medium C, Plants 2 and 3 had shorter heights.
Michelle is utilizing the electromagnetic spectrum in her experiment. She takes note of the wavelength, frequency, and speed of various waves as she examines them.
On the electromagnetic spectrum, a brand-new radiation with a frequency greater than gamma rays has been found. What would be the most likely speed of it?

Every wave, regardless of its frequency, travels at the same speed of 299,792,458(m/s). The newly found wave would travel at a speed of 299,792,458(m/s).