
How To Find Median In Excel (Step-By-Step Guide With Examples) 2026 September
Find the median in Excel using the MEDIAN function. 🆕 Step-by-step examples for ranges, ignoring zeros, conditional medians, and common errors fixed.

Why The Median Matters More Than The Average
You crunch numbers all day in Excel, and 9 times out of 10 you probably reach straight for AVERAGE. Fair enough — it’s quick, it’s familiar, and it gives you a single tidy figure. But here’s the catch: AVERAGE gets dragged around by extremes. One huge outlier, and your “typical” number is suddenly nonsense.
That’s where the median earns its keep. The median is the middle value once your data is sorted. Half above, half below. Outliers can’t bully it.
Think salaries. Or house prices. Or response times. Anywhere skew shows up, the median tells a cleaner story.
This guide walks you through every practical way to find the median in Excel — from a one-cell formula to conditional medians using array tricks. You’ll get clear examples, fixes for the errors that bite beginners, and tips that aren’t in the help docs.
The MEDIAN Function: Syntax And First Example
Excel has a built-in function for this exact job. It’s called MEDIAN. The syntax is straightforward:
=MEDIAN(number1, [number2], ...)
You can pass it individual numbers, a single range, or several ranges at once. Up to 255 arguments. That’s a lot of room.
Quick example. Put these values in cells A1 through A7: 12, 18, 7, 25, 9, 14, 22. In any other cell, type:
=MEDIAN(A1:A7)
Hit Enter. You get 14. Why? Sort the numbers — 7, 9, 12, 14, 18, 22, 25 — and 14 sits dead in the middle. That’s your median.
Even count? Excel averages the two middle values for you automatically. No extra step.
Step-By-Step: Finding The Median In Your Own Spreadsheet
Let’s do this together. Open a fresh workbook.
Step 1. Pop your dataset into column A. Anything goes — sales, test scores, ages, salaries. Pick a range that makes sense for your work.
Step 2. Click an empty cell. Somewhere visible, like B1.
Step 3. Type =MEDIAN( and then drag-select the data range, or just type it: A1:A50. Close the bracket. Press Enter.
Step 4. Done. The cell now shows your median.
Want to label it? Drop “Median:” into A52 and your formula in B52. Clean.
One more trick: select your data first, then look at the status bar at the bottom of Excel. Right-click it, tick Median, and Excel shows the median of any selection in real time. Brilliant for quick checks.
How Excel Handles Even Versus Odd Counts
Here’s a detail that trips people up. With an odd number of values, the median is a single middle number — nothing fancy. With an even count, there’s no single middle. So Excel takes the two middle values and averages them.
Example with five numbers: 3, 8, 11, 14, 20. Middle value is 11. MEDIAN returns 11.
Example with six numbers: 3, 8, 11, 14, 20, 22. The two middle values are 11 and 14. Their average is 12.5. MEDIAN returns 12.5.
You don’t do any of this yourself. Excel handles it silently. But knowing the rule helps when results look “off” — they usually aren’t.
If you want to verify, our walkthrough on how to calculate mean in excel shows the contrast nicely.
MEDIAN Function At A Glance

Quickest Way To Find Median In Excel
Type =MEDIAN(A1:A100) into any empty cell, replace the range with your data, and press Enter. That's it — Excel sorts the values internally and returns the middle one. No need for a helper column, no sorting first, no manual math, no add-ins. The MEDIAN function ships with every version of Excel released since 2003.
What MEDIAN Ignores (And What It Doesn’t)
MEDIAN is picky in a useful way. It quietly skips empty cells. It also skips text values and logical TRUE/FALSE when they’re inside a range reference. Numbers stored as text? Same story — ignored.
But there’s a twist. If you type a logical value directly as an argument (not via a reference), it counts: =MEDIAN(1,2,TRUE) returns 1, treating TRUE as 1.
Empty cells are not zeros. That matters. If 10 of your 50 cells are blank, MEDIAN works on the 40 cells with numbers. Add 10 zeros instead, and you get a very different answer.
Always check your source range. Blanks vs zeros is the silent killer of accuracy.
Finding A Median While Ignoring Zeros
Real datasets are messy. Zero values from incomplete surveys, no-show appointments, days a shop was closed — including them can pull your median down to zero or near it. Sometimes you want them out.
The trick: combine MEDIAN with IF inside an array formula. In modern Excel (Microsoft 365 or 2021+) just type:
=MEDIAN(IF(A1:A100<>0, A1:A100))
Press Enter. Done. Excel evaluates it as an array because MEDIAN is array-aware.
On older Excel (2019 and earlier)? Same formula, but you must finish with Ctrl + Shift + Enter instead of just Enter. Excel wraps it in curly braces — that’s how you know it’s an array formula.
You can swap the condition. Want medians above 50? =MEDIAN(IF(A1:A100>50, A1:A100)).
Conditional Median: MEDIAN With Criteria
Excel never gave us MEDIANIF or MEDIANIFS — an annoying gap. Unlike AVERAGEIF and SUMIFS, there’s no built-in for “median where region equals West.” You have to roll your own with arrays.
Imagine column A has regions and column B has sales. To get the median sale for the West region:
=MEDIAN(IF(A2:A1000="West", B2:B1000))
Modern Excel: hit Enter. Older versions: Ctrl + Shift + Enter.
Need multiple conditions? Nest your IFs or multiply boolean arrays:
=MEDIAN(IF((A2:A1000="West")*(C2:C1000=2024), B2:B1000))
The trick is that TRUE * TRUE equals 1, and anything else equals 0. IF then returns your data only where the combined condition is 1. Slick once you see it.
Using MEDIAN With Excel Tables (Structured References)
If your data lives in a proper Excel Table (Insert > Table), structured references make formulas readable and resilient. Add new rows and your median updates automatically — no editing the range.
Suppose your table is called SalesData and you want the median of the Amount column:
=MEDIAN(SalesData[Amount])
Cleaner than =MEDIAN(B2:B1000), right? And it survives sorting, filtering, and rows being inserted in the middle.
Conditional version with a table:
=MEDIAN(IF(SalesData[Region]="West", SalesData[Amount]))
Tables are massively underused. If you find yourself rebuilding ranges every month, this is your fix.
Three Ways To Calculate Median
Use =MEDIAN(range) for a plain median across a single block of numbers. Works on rows, columns, or rectangular ranges. Excel sorts the values internally and returns the middle one with zero setup.
- ▸Single range or up to 255 arguments
- ▸Skips text and empty cells automatically
- ▸Handles odd and even counts on its own
Combine MEDIAN with IF as an array formula to compute the median that meets criteria, such as sales by region or scores by class. Multiply boolean arrays for multi-condition logic.
- ▸MEDIAN(IF(criteria, values))
- ▸Ctrl+Shift+Enter on Excel 2019 and older
- ▸Modern Excel: just press Enter
PivotTables don't expose Median in the standard dropdown. Use a helper column with MEDIAN(IF) per group, or switch to Power Pivot and write a DAX measure to summarize medians dynamically.
- ▸Helper column for static medians
- ▸Power Pivot for dynamic measures
- ▸DAX: MEDIAN(Table[Column])
Median In A PivotTable (The Workaround)
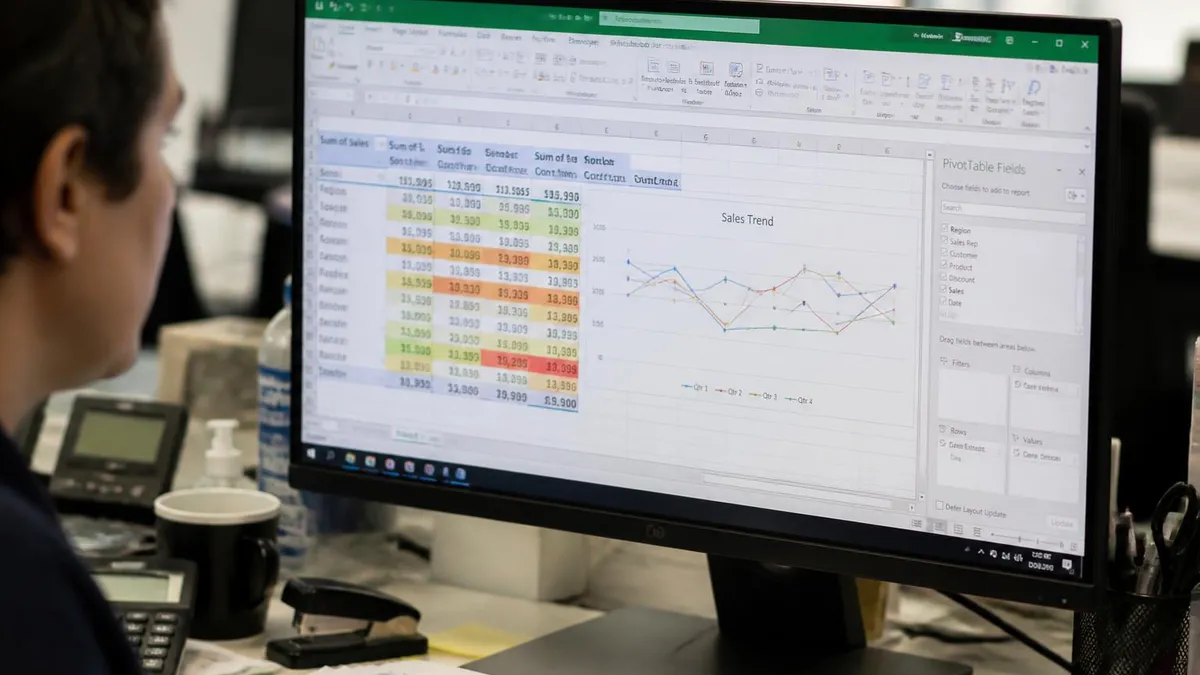
Bad news first: PivotTables don’t offer Median as a default summary function. The dropdown gives you Sum, Count, Average, Max, Min, but no Median. Microsoft, please.
Good news: there are two workarounds.
Workaround 1 — helper column. Add a column to your source data that computes the median per group using MEDIAN(IF…). Then pivot on that. Set summary to Average or Min; values are constant per group anyway.
Workaround 2 — Power Pivot DAX. If your data model is loaded into Power Pivot, write a measure:
MedianAmount := MEDIAN(SalesData[Amount])
Drag the measure into Values. Done. Real median, per row label, dynamic.
Power Pivot is on the Data tab if it’s not visible. Enable it once and you’ve got real statistics in pivots forever.
Common Errors When Using MEDIAN (And How To Fix Them)
You’ll hit these eventually. Here’s what they mean.
#NUM! — You gave MEDIAN nothing to chew on. Usually happens with array conditions that exclude every row. Check that at least one value matches.
#VALUE! — A direct argument is text or an unsupported type. Inside a range? It’d be ignored. Typed directly? It errors.
Wrong answer. Common cause: numbers stored as text. They show up but get skipped. Use VALUE() or a quick paste-special multiply-by-1 to convert. Our how to find standard deviation in excel guide covers the same conversion pitfall.
Median always zero. Your range has too many literal zeros. Switch to the ignore-zeros pattern shown earlier.
Spilled array error in older Excel. Forgot Ctrl + Shift + Enter on the conditional version. Press F2, then Ctrl + Shift + Enter to fix.
Why MEDIAN Is The “Robust” Statistic
Statisticians have a word for measures that ignore outliers: robust. MEDIAN is the textbook example.
Imagine ten numbers averaging 100. Replace one of them with 10,000. The mean jumps to roughly 1,090. The median? Barely moves. That single extreme value can’t flip the middle position much — unless your dataset is tiny.
This is why financial analysts, healthcare researchers, and operations teams default to medians for skewed metrics. Bonuses, hospital stays, page load times — all of them have long right tails. Means lie. Medians don’t.
If your audience cares about “what does a typical person see,” reach for MEDIAN first. Save AVERAGE for symmetric data where you genuinely want every value to pull its weight.
Worked Example: Median Salary By Department
Let’s say HR drops a sheet on your desk. Column A: department. Column B: salary. 500 rows.
You want the median salary for Engineering. Type this in any empty cell:
=MEDIAN(IF(A2:A501="Engineering", B2:B501))
Modern Excel: Enter. Older Excel: Ctrl + Shift + Enter.
Drag the formula down for other departments, swapping the text in quotes. Or better — reference a cell with the department name so you can list every department in a small table without retyping.
Put department names in D2:D8, and beside each one use:
=MEDIAN(IF($A$2:$A$501=D2, $B$2:$B$501))
Lock the ranges with dollar signs. Fill down. Eight medians, eight seconds of work. Tidy.
MEDIAN Formula Examples
=MEDIAN(B2:B500)
Returns the median of every numeric value in column B from row 2 to row 500. Blanks and text are ignored automatically, so partially populated columns still work correctly. Use this when your dataset is in one contiguous range.

If your data was imported from CSV or pasted from the web, some values may be text that looks numeric. MEDIAN silently skips them, so your median may be calculated from far fewer values than you think. Highlight the column, click the warning triangle, and choose Convert to Number — or use VALUE() in a helper column. Always sanity-check by comparing COUNT(range) and COUNTA(range): if those numbers differ, you have text-stored numbers polluting the column.
Before You Trust Your Median Result
- ✓Check for blanks vs zeros — they behave very differently in MEDIAN
- ✓Convert any text-stored numbers using VALUE() or paste-special multiply by 1
- ✓Confirm your range covers every relevant row, not just the currently visible rows
- ✓Compare MEDIAN and AVERAGE side by side to spot skew in the distribution
- ✓On older Excel, always finalize conditional array formulas with Ctrl + Shift + Enter
- ✓If results look wrong, audit with F2 and check the highlighted range covers the right cells
- ✓For tables, switch to structured references so the formula adjusts when rows are added
- ✓Use the status bar Median readout for quick sanity checks against your formula output
Advanced: Weighted Medians And Quartiles
Sometimes you don’t want a plain median — you want a weighted one. Each value carries a weight (frequency, revenue share, sample size).
Excel won’t do this directly. The trick is to expand the dataset using SUMPRODUCT or a helper column repeating each value by its weight. Then run MEDIAN on the expanded list. Hacky? A bit. Effective? Absolutely.
For quartiles, use QUARTILE.INC or QUARTILE.EXC. The median equals QUARTILE.INC(range, 2). Quartile 1 is the 25th percentile, quartile 3 is the 75th. Together with median, they’re the backbone of box-and-whisker charts.
If you’re analyzing distributions, learning standard deviation in excel alongside median gives you a far richer picture than either alone.
Real-World Scenarios Where Median Beats Average
Median isn’t just academic. Some everyday cases:
Salary reporting. A team of nine earns between $50k and $80k. The boss earns $400k. Mean is north of $90k. Median is around $65k. Which one represents what most people make? Median, every time.
Tools like excel formulas let you cross-check by combining MEDIAN with AVERAGE in adjacent cells. If they diverge a lot, your data is skewed.
Customer wait times. A small number of long waits drag the mean up. Median tells you what a typical customer experiences.
House prices in a city. A handful of mansions break the average. Real estate sites quote medians for a reason.
Response time monitoring. Median latency is the standard server-side metric. Slow outliers go to a separate percentile measurement.
Dynamic Arrays: How New Excel Changes The Game
Got Microsoft 365 or Excel 2021? Dynamic arrays change everything. The clunky Ctrl + Shift + Enter ritual is gone.
Type =MEDIAN(IF(A1:A100<>0, A1:A100)) and just press Enter. Excel handles the array internally. No curly braces, no special key combo, no fear of accidentally breaking the formula by editing it.
Combine with FILTER for serious power:
=MEDIAN(FILTER(B2:B500, A2:A500="West"))
FILTER pulls the matching values into a virtual array, MEDIAN crunches them. Reads beautifully. Easier to debug than nested IFs.
You can also pair MEDIAN with UNIQUE to get a median per category in one spilled formula. Or use LET to name parts of complex expressions for readability. Modern Excel makes statistical work feel less like wrestling.
Visualizing Median In Charts
A single number is useful, but a chart tells the story faster. Excel offers a Box and Whisker chart type that places median, quartiles, and outliers on one tidy plot. It’s under Insert > Charts > Statistical > Box and Whisker.
Select your raw data first, then insert. Each box shows the median as a horizontal line inside the box, quartiles as the box edges, and outliers as dots. Compare boxes side by side to spot which group has more spread.
If you want to overlay the median on a regular line or bar chart, calculate it in a helper cell and add it as a constant series. Right-click the new series, pick Change Series Chart Type, and set it to Line. You’ll get a horizontal “median bar” across the chart — quick, clean, instantly readable.
Keyboard Shortcuts And Speed Tips
Fast wins for the regulars:
Press Alt + = for AutoSum, then arrow-key over to MEDIAN by typing it after the equals sign. Saves a hunt through the function library.
Use F4 right after selecting a range to lock references with dollar signs — useful when copying conditional median formulas across a column.
Drag the fill handle while holding Ctrl to skip the auto-increment. Handy for filling MEDIAN formulas where the range should stay constant.
And the status-bar trick I mentioned earlier? Right-click the status bar, enable Median, and you’ve got a live readout every time you select a range. No formula required.
Putting It All Together
Median is one of the most useful, most under-used numbers in Excel. The basic MEDIAN function takes two seconds. The advanced array versions handle nearly every real-world quirk — conditional medians, ignoring zeros, multiple criteria, structured tables, even pivots with a workaround.
Master the syntax once, learn the array trick once, and you’ll never again present a misleading average to a meeting where someone smart can spot the skew.
Want to keep going? Brush up on related stats in excel functions or branch into percentage formula in excel for more analytical work.
And if your day-to-day involves cross-checking results against other summary stats, the patterns shown here — basic, conditional, table-aware — transfer directly to AVERAGEIFS, STDEV.S, and percentile functions. The investment compounds.
Median Vs Mean: Quick Comparison
- +Resistant to extreme outliers
- +Better for skewed distributions like income or wait times
- +Reports a value that actually exists in odd-count datasets
- +Industry standard for response times and salary reporting
- −Less useful for symmetrical, well-behaved data
- −Harder to compute manually than a mean
- −Not natively available in PivotTable summaries
- −Doesn't combine arithmetically the way averages do
MEDIAN Questions and Answers
About the Author

Business Consultant & Professional Certification Advisor
Wharton School, University of PennsylvaniaKatherine Lee earned her MBA from the Wharton School at the University of Pennsylvania and holds CPA, PHR, and PMP certifications. With a background spanning corporate finance, human resources, and project management, she has coached professionals preparing for CPA, CMA, PHR/SPHR, PMP, and financial services licensing exams.