Excel Gantt Chart: Step-by-Step Creation Guide for Project Managers 2026 June
📚 Create Excel Gantt charts step-by-step using stacked bar charts, conditional formatting, and templates plus tips for project schedules and dependency

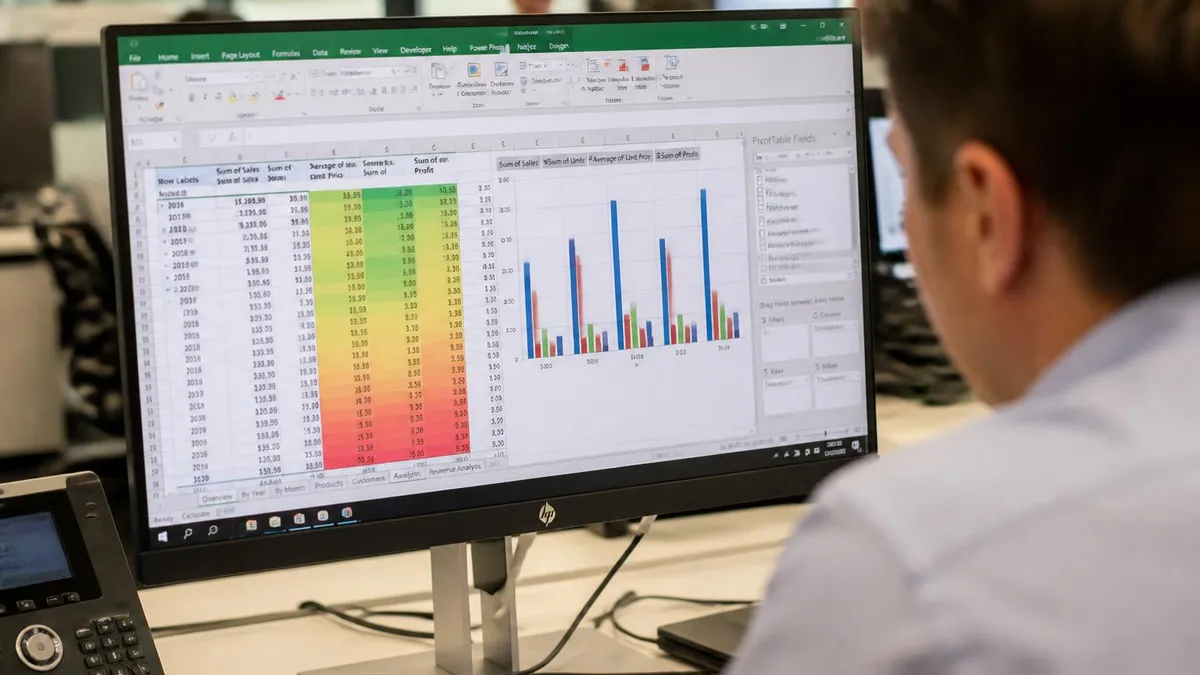
What an Excel Gantt Chart Provides
An Excel Gantt chart visualizes project schedules through horizontal bars showing task durations across time. The chart format invented by Henry Gantt in the early twentieth century remains the most widely recognized project schedule visualization. Project managers use Gantt charts to communicate timelines, identify dependencies, track progress, and coordinate work across teams. Excel provides several approaches to creating Gantt charts ranging from simple stacked bar charts to sophisticated templates with dependencies and progress tracking.
Creating Gantt charts in Excel rather than specialized project management software offers several advantages. Excel is universally available across organizations, eliminating software licensing costs for occasional Gantt chart needs. Familiarity with Excel reduces learning curve compared to dedicated project management applications. Integration with other Excel features including formulas, conditional formatting, and PivotTables supports analytical capabilities that some specialized tools lack despite their stronger Gantt-specific features.
Excel Gantt charts suit smaller projects with a few dozen tasks better than enterprise programs with hundreds of tasks across many resources. Microsoft Project, Smartsheet, Asana, Jira, and other specialized tools handle complex programs more effectively than Excel can. The choice between Excel and dedicated tools depends on project complexity, team size, and existing organizational standards rather than reflecting absolute superiority of either approach for all project management scenarios.
Gantt chart usage extends across construction, software development, marketing, event planning, manufacturing, and many other industries that manage time-bound projects. Construction superintendents track building schedules through Gantt charts showing trades coordinating across phases. Software development managers visualize sprint timelines and release schedules. Marketing teams plan campaign launches with overlapping content production tasks. The format universally translates across these diverse applications.
Visual processing advantages of Gantt charts explain their enduring popularity. The horizontal bar format leverages spatial perception that humans process much faster than reading sequential task lists. A glance at a Gantt chart conveys overall project shape that paragraph-form schedule descriptions could not match. The cognitive efficiency makes Gantt charts effective for stakeholder communication where viewer attention is limited and quick understanding matters most.
Excel Gantt Chart Quick Facts
Excel Gantt charts use stacked bar charts as the primary creation method. Tasks list in rows with start date and duration columns. The chart hides the start date bars to leave only duration bars visible producing the Gantt effect. Free templates available from Microsoft and third parties speed creation. Conditional formatting offers alternative approaches without using charts.
Templates from Microsoft Office Templates accessible through File menu New option include several free Gantt chart designs. Third-party sources including Smartsheet and Vertex42 offer additional free templates with varying complexity and features.
Stacked Bar Chart Approach
The stacked bar chart approach produces the most authentic Gantt chart appearance in Excel. The technique uses three columns of data for each task: task name, start date, and duration in days. Selecting this data and inserting a stacked bar chart creates two series with start dates stacked left of duration bars. Hiding the start date series by setting its fill to no fill makes only the duration bars visible, producing the Gantt chart appearance.
Sorting the task list in chronological order produces clean visual flow from top to bottom matching how readers naturally scan Gantt charts. Without sorting, tasks appear in source data order which may not match actual sequence. The Sort feature on the Data tab handles this easily. Locking the sort to a specific column prevents accidental reordering when subsequent changes occur to underlying data during project execution.
Date axis formatting adjusts the time scale to match project duration. Right-clicking the horizontal date axis and choosing Format Axis opens options for minimum and maximum dates plus tick interval choices. Setting minimum to project start date and maximum to project end date concentrates the visualization on relevant time. Daily, weekly, or monthly tick intervals adjust based on project length and detail level needed for the audience.
Reversing the category axis to show tasks in top-to-bottom order rather than bottom-to-top requires specific chart configuration. Right-click the vertical category axis and choose Format Axis. Check the Categories in Reverse Order option. The change moves the first task to the top of the chart where most readers expect to find it. Many Gantt chart problems trace to this simple configuration that initially produces inverted task order.
Date format adjustments improve readability for projects spanning specific time scales. Short date format suits weekly projects. Month-year format suits multi-month projects. Custom formats including week numbers, quarters, or fiscal year periods serve specific organizational needs. Right-click the date axis and choose Format Axis to access these options. Matching format to project timeline produces cleaner charts than Excel default settings often deliver.

Excel Gantt Chart Approaches
Standard approach using stacked bar chart with start date and duration columns. Most authentic Gantt appearance suitable for project presentations and stakeholder communication. Choosing the right approach depends on project complexity, user Excel proficiency, and communication audience.
Alternative approach using conditional formatting on date grid to highlight task duration cells. No chart object required producing simpler integration with surrounding worksheet content. Choosing the right approach depends on project complexity, user Excel proficiency, and communication audience.
Pre-built Gantt chart templates from Microsoft Office Templates and third-party sources. Faster than building from scratch with established layouts and formulas already in place. Choosing the right approach depends on project complexity, user Excel proficiency, and communication audience.
Excel add-ins from third parties providing dedicated Gantt chart functionality. Offers features beyond native Excel capability such as dependencies and progress tracking with simpler interfaces. Choosing the right approach depends on project complexity, user Excel proficiency, and communication audience.
Step-by-Step Stacked Bar Method
Begin Gantt chart creation by setting up task data in three columns. Column A contains task names. Column B contains start dates formatted as dates. Column C contains duration in days as numbers. Add header row at the top with column labels. Enter all project tasks with their respective start dates and durations. Sort by start date to produce chronological order in the resulting chart.
Select all three columns including headers. Click the Insert tab on the ribbon and choose the bar chart icon. Select the stacked bar variant from the dropdown. Excel creates an initial chart with two series, one for start dates and one for durations. Both series appear as visible bars at this point. Subsequent steps will hide the start date series to produce the Gantt chart appearance.
Format the start date series to be invisible. Right-click the first set of bars representing start dates and choose Format Data Series. In the Fill section, select No Fill to remove the bar color. In the Border section, select No Line to remove the bar outline. The bars become invisible leaving only the duration bars visible. The result resembles standard Gantt chart visualization with tasks running from their start dates for their specified durations.
Chart sizing affects readability significantly. Default Excel chart sizes often produce charts too small to read comfortably for projects with many tasks. Resizing the chart by dragging corners or setting specific dimensions through Format Chart Area options produces appropriately sized output. Charts intended for projection or large display may need scaling adjustments beyond what default sizes provide for individual screen viewing.
Adding chart titles, axis titles, and data labels improves communication clarity. Click the chart and the plus icon to access element options. Adding clear chart titles such as Project Schedule Through Q3 2026 sets immediate context. Axis titles such as Tasks and Date orient readers to chart structure. Strategic data labels highlight specific milestones or critical tasks deserving attention beyond what bars alone convey to viewers.
Gantt Chart Customization Options
Color coding tasks by category, phase, or team improves chart readability. Right-click individual bars and choose Format Data Point to change colors. Pattern fills support diverse categories beyond solid colors alone. Consistent color schemes across multiple Gantt charts maintain visual continuity for organizations using Gantt charts regularly.
Customization options should match the specific communication needs of the audience and the project complexity rather than applying maximum features regardless of necessity.
Conditional Formatting Alternative
Conditional formatting offers an alternative Gantt chart approach without using actual chart objects. The technique uses a date grid across columns and tasks down rows. Conditional formatting rules highlight cells where the column date falls within the task duration. The result resembles a Gantt chart but stays integrated with the underlying data without separate chart object overhead.
Setting up the conditional formatting approach starts with creating columns for each day, week, or other time unit of the project. Each row represents a task with start date and end date columns. Conditional formatting rule uses a formula such as equals AND open paren column header date greater than or equal task start date comma column header date less than or equal task end date close paren to identify cells within task duration. The rule highlights matching cells producing the Gantt appearance.
Advantages of the conditional formatting approach include direct visibility of dates alongside task bars, easier editing through cell value changes rather than chart manipulation, and seamless integration with formulas calculating progress, dependencies, and resources. Disadvantages include less professional appearance compared to chart-based Gantt charts and limited customization options for advanced visual effects.
Date column generation for the conditional formatting approach can use formulas rather than manual entry. The formula equals A1 plus 1 in column B and copied across produces sequential dates after entering project start date in A1. The dynamic approach updates automatically when start date changes. Daily, weekly, or biweekly intervals support different project granularity through formula adjustments.
Multiple conditional formatting rules support complex visualization including progress tracking and color-coded categories. One rule highlights task duration cells in default color. A second rule overlays completion percentage through different color or pattern. A third rule color-codes by task category. Layering multiple rules produces sophisticated visualization that pure chart approaches cannot easily replicate in Excel native capability.
Excel Gantt charts work well for small to medium projects but struggle with large complex programs. Microsoft Project, Smartsheet, and other dedicated tools handle hundreds of tasks, resource leveling, dependency management, and team collaboration better than Excel can replicate. Choose tools matching project complexity rather than forcing Excel to handle scenarios where dedicated tools excel.
Most projects under thirty tasks fit Excel capabilities well. Beyond that scale, dedicated tools handle complexity, dependencies, and resource management better than spreadsheet approaches can practically support.
Free Gantt Chart Templates
Microsoft Office Templates includes several free Gantt chart templates accessible through the File menu New option in Excel. Search for Gantt or project to find available templates. Templates vary from simple task lists with basic bars to sophisticated project dashboards with multiple views. Downloading templates and modifying them for specific projects saves time compared to building Gantt charts from scratch.
Third-party Gantt chart templates from sources including Smartsheet, Vertex42, and others offer alternative designs and features. Many third-party templates are free while others require purchase. Reading user reviews before downloading reveals template quality and ease of customization. Personal preferences about layout and features should drive template selection more than minor differences between similar offerings.
Customizing templates to match specific project needs requires understanding underlying formulas and chart configuration. Most templates include complex interconnected formulas that produce dynamic behavior. Casual modifications can break this logic producing broken templates. Reviewing template documentation, watching tutorial videos, or copying templates to safe locations before modification protects against accidental destruction of template functionality.
Smartsheet templates often provide more sophisticated functionality than basic Microsoft templates including built-in dependency support, automatic calculation of dates from durations and dependencies, and integrated resource tracking. Smartsheet operates a freemium model where basic features are free but advanced features require paid subscription. Excel users can download free Smartsheet templates to use within Excel even without Smartsheet subscription.
Template documentation quality varies substantially. Well-documented templates explain underlying formulas, customization procedures, and limitation areas. Poorly documented templates require reverse engineering to understand and modify safely. Reading template documentation before relying on it for important projects prevents discovering hidden assumptions through unexpected behavior during active project tracking when problem-solving is most disruptive.
Excel Gantt Chart Creation Checklist
- ✓Identify all project tasks with realistic durations and dependencies before starting chart creation
- ✓Set up three columns for task name, start date, and duration as basic chart data foundation
- ✓Sort tasks chronologically by start date for clean visual flow in the resulting chart
- ✓Insert stacked bar chart and hide the start date series to produce Gantt appearance
- ✓Format date axis with appropriate minimum, maximum, and tick interval for project length
- ✓Apply color coding by task category, phase, or team for improved readability of complex charts
- ✓Consider conditional formatting alternative or templates if stacked bar approach proves difficult
- ✓Verify task list completeness before chart creation to avoid rework when missing tasks emerge later
- ✓Test the chart with sample data before populating with actual project information to verify visual approach
Adding Progress Tracking
Progress tracking transforms static Gantt charts into dynamic project monitoring tools. Adding a percent complete column for each task supports visualization through partial bar coloring or overlays showing completion. The stacked bar chart approach can incorporate progress by adding a third series representing completed duration as a different color overlaying the duration bars.
The three-series approach uses task name, start date, completed duration, and remaining duration columns. The stacked bar chart with all four columns produces invisible start date bars, visible completed bars in one color, and visible remaining bars in another color. The visual contrast shows progress at a glance making the chart useful for status meetings and stakeholder updates throughout project execution.
Manual percent complete updates require regular maintenance to keep charts current. Some teams update percent complete weekly or biweekly during status meetings. Others automate updates through formulas connected to actual work tracking systems. The chosen update cadence should match project pace and stakeholder reporting needs. Excessive update frequency wastes time while insufficient updates compromise chart usefulness for monitoring.
Color coding completed work versus remaining work strengthens visual communication of project status. Green for completed work and red for delayed remaining work creates intuitive status awareness. Some teams use specific status colors including green for on-track, yellow for at-risk, and red for delayed. The color scheme should be consistent across multiple Gantt charts to support visual learning by stakeholders viewing charts regularly.
Milestone markers add specific reference points beyond duration bars. Inserting milestone tasks with zero duration produces points rather than bars on the chart. Diamond shapes or other distinctive markers commonly represent milestones in Gantt chart conventions. Including milestone markers for project gates, deliverable due dates, and key decision points highlights structural elements beyond just continuous task durations.
Limitations and Workarounds
Excel cannot natively handle task dependencies the way Microsoft Project does. Creative formulas can simulate dependencies through linking start dates to predecessor end dates. Setting Task B start date equal to Task A end date plus one day creates implicit dependency. Changes to Task A automatically propagate to Task B. The approach works for simple sequential dependencies but struggles with complex multi-predecessor or partial overlap dependencies that dedicated tools handle naturally.
Resource leveling across multiple tasks competing for the same workers is beyond Excel native capability. Project management tools provide automatic resource leveling that adjusts schedules to prevent resource overallocation. Excel users must manually identify and resolve resource conflicts through careful schedule design. Larger projects with substantial resource constraints benefit from dedicated tools beyond what Excel can practically manage.
Critical path analysis identifying the longest sequence of dependent tasks requires manual calculation in Excel rather than automatic computation. Project management tools highlight critical path tasks automatically helping focus management attention where schedule risk is highest. Excel users can document critical path through analysis but the manual approach can miss updates when task durations change during project execution.
Multiple project tracking in Excel becomes unwieldy beyond a handful of concurrent projects. Each project requires its own Gantt chart with separate maintenance. Dedicated project management tools handle multi-project portfolios with unified views, shared resources, and roll-up reporting that Excel cannot easily replicate. Organizations managing many concurrent projects benefit from portfolio-oriented tools beyond what Excel can practically support.
Earned value management integration with Excel Gantt charts is possible through additional formulas computing planned value, earned value, and actual cost across project tasks. The integrated approach supports advanced project performance analysis. However, the complexity quickly exceeds what most Excel users can comfortably maintain. Dedicated tools provide cleaner earned value implementation for projects requiring this advanced project management discipline.

Excel Gantt Chart Quick Numbers
When to Use Each Approach
Best for professional presentations to stakeholders. Most authentic Gantt appearance suitable for executive reviews and external communication needs. Choosing the right approach depends on project complexity, user Excel proficiency, and communication audience.
Best for internal team tracking integrated with task details. Direct visibility of dates and easy editing through cell value changes support active project management. Choosing the right approach depends on project complexity, user Excel proficiency, and communication audience.
Best for occasional Gantt chart needs without time investment in creation. Established layouts and formulas provide immediate productivity for users who do not specialize in Excel. Choosing the right approach depends on project complexity, user Excel proficiency, and communication audience.
Best for complex programs with many tasks, dependencies, and resources. Microsoft Project, Smartsheet, or similar tools handle complexity that Excel struggles with effectively. Choosing the right approach depends on project complexity, user Excel proficiency, and communication audience.
Sharing and Collaboration
Sharing Excel Gantt charts with stakeholders works through standard Excel sharing methods. Email attachments deliver completed charts but produce snapshots that may not reflect subsequent project changes. Shared workbooks on cloud platforms including OneDrive, SharePoint, or Google Drive provide dynamic access where all viewers see current versions. Sharing dynamic versions through cloud platforms typically supports better project communication.
Exporting Gantt charts to PDF or image formats supports inclusion in presentations and reports. The Page Setup options control how the chart prints with margin, scale, and orientation settings. Adjusting these settings before export ensures professional appearance in the final document. Many stakeholders prefer PDF or image versions over native Excel files because they ensure visual consistency across viewing platforms.
Collaboration on shared Excel Gantt charts works for small teams but becomes problematic with many concurrent editors. Conflicting edits, lost changes, and version confusion all increase as the editing team grows. Larger collaborative projects benefit from project management platforms specifically designed for multi-user environments rather than spreadsheets primarily designed for individual or small-group work.
Embedding Gantt charts in PowerPoint presentations for stakeholder briefings supports executive communication. Linking the embedded chart to the source Excel file enables automatic updates when the Excel file changes. Copying charts as static images produces snapshots that do not update. Both approaches have appropriate use cases depending on whether continuous synchronization matters for the specific communication scenario.
Version control challenges arise as projects extend over time. Maintaining historical versions of Gantt charts supports retrospective analysis after project completion. SharePoint version history, file system snapshots, or explicit version filename conventions all support historical preservation. Organizations frequently using Gantt charts benefit from established version control practices that scale across many projects over years of accumulated work history.
Excel Gantt Chart Pros and Cons
- + —
- + —
- + —
- + —
- + —
- − —
- − —
- − —
- − —
- − —
Excel Questions and Answers
About the Author
Business Consultant & Professional Certification Advisor
Wharton School, University of PennsylvaniaKatherine Lee earned her MBA from the Wharton School at the University of Pennsylvania and holds CPA, PHR, and PMP certifications. With a background spanning corporate finance, human resources, and project management, she has coached professionals preparing for CPA, CMA, PHR/SPHR, PMP, and financial services licensing exams.